


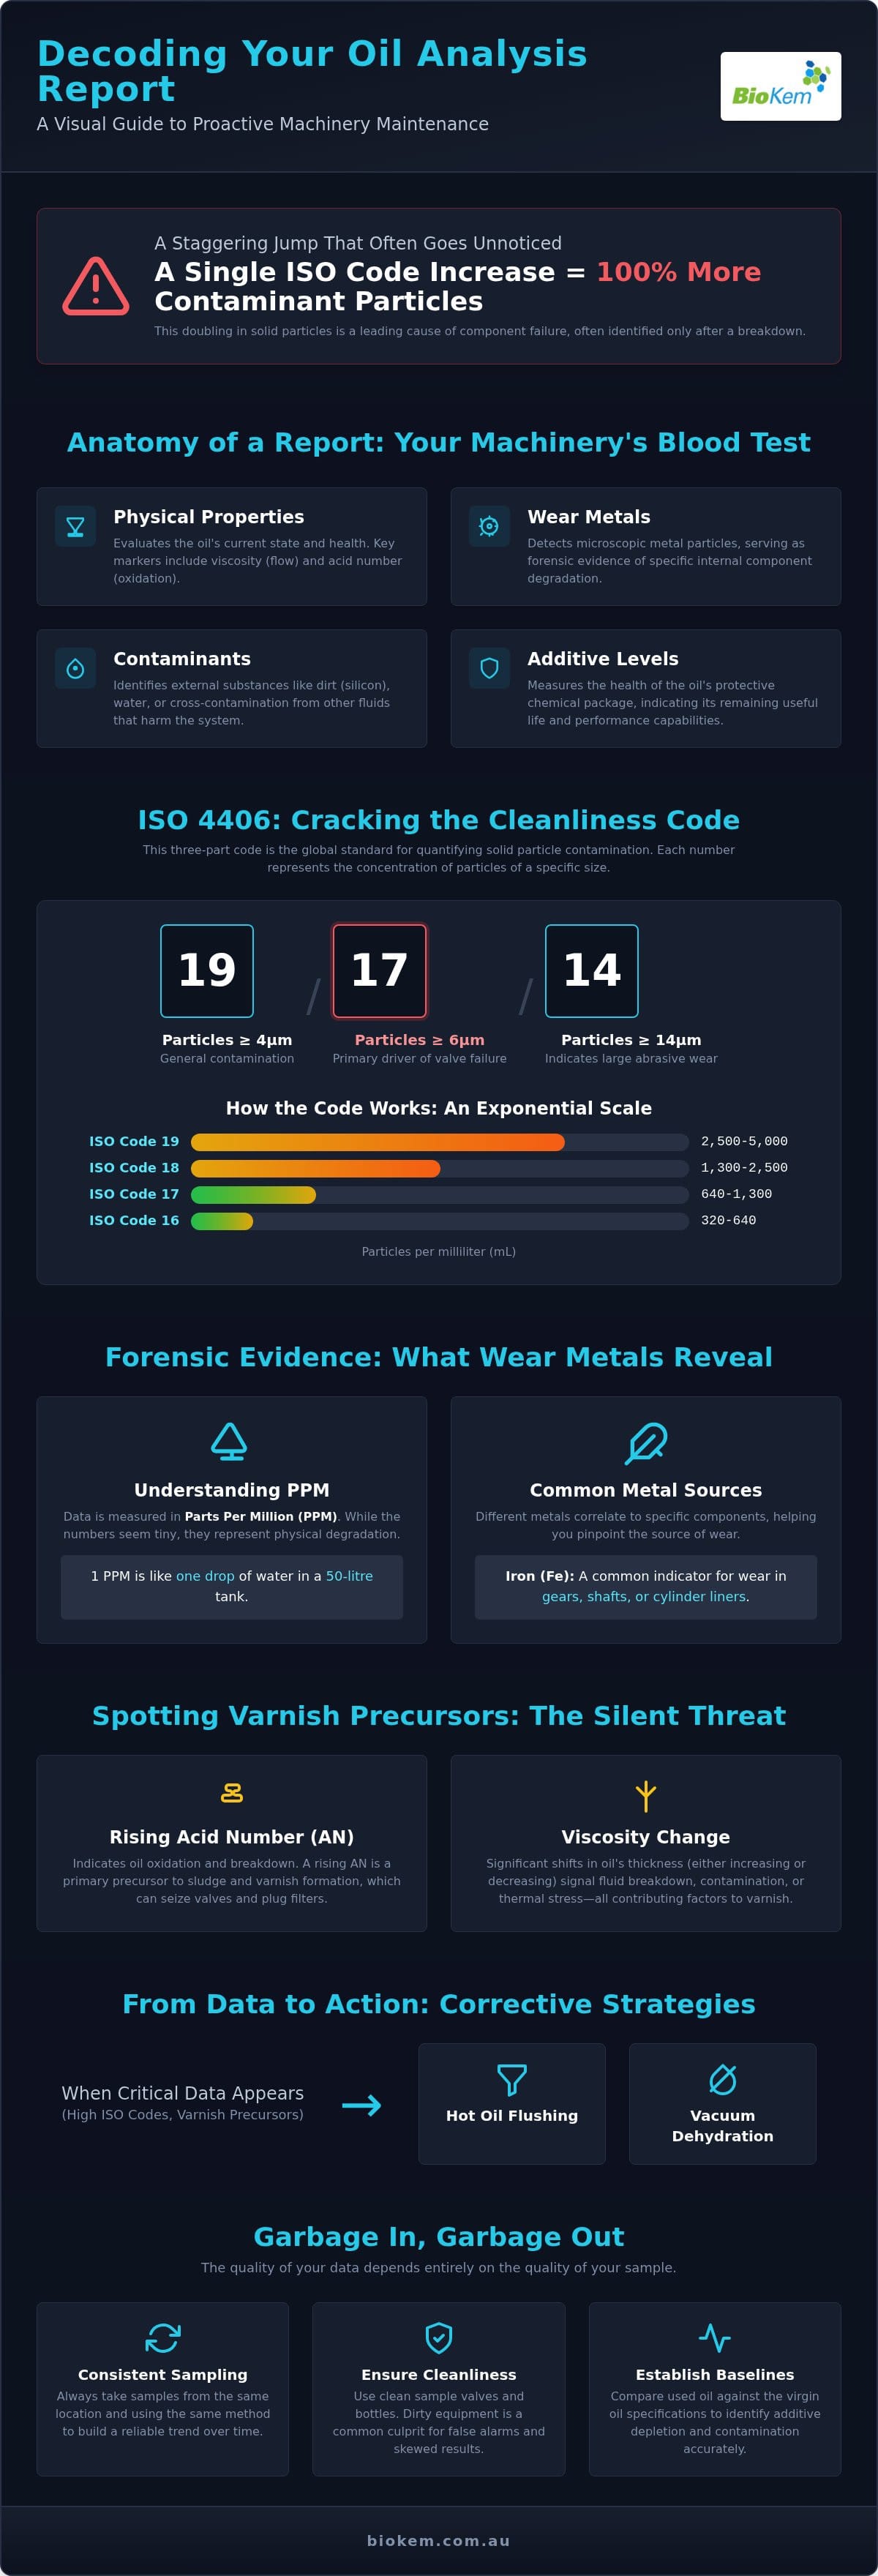
Did you know that a single code increase in your ISO 4406 rating represents a 100% increase in the concentration of solid particles within your system? It is a staggering jump that often goes unnoticed until a critical component fails. Understanding how to read an oil analysis report is the difference between proactive reliability and reactive chaos. Most maintenance managers feel a sense of information overload when lab data arrives, finding it difficult to translate chemical markers into a business case for the maintenance budget. You’re likely concerned that missing one subtle warning sign could lead to a catastrophic equipment breakdown.
This guide provides a clear framework for decoding laboratory data with professional precision. We’ll examine the latest ISO 4406:2021 standards and the 2024 updates to ISO 21018-1, showing you how to identify varnish precursors before they compromise your turbines or hydraulic circuits. You will gain the technical confidence to move beyond simple data observation and start ordering targeted solutions, such as hot oil flushing or vacuum dehydration, to extend asset life and ensure long term operational health.
Key Takeaways
- Learn to categorize laboratory data into physical properties, wear metals, contaminants, and additive levels to view your oil report as a diagnostic blood test for your assets.
- Discover how to read an oil analysis report to pinpoint specific component wear by identifying metal types and understanding parts-per-million (ppm) metrics.
- Decode the ISO 4406 cleanliness code with a focus on 6-micron particles, which are the primary drivers of valve failure and hydraulic system instability.
- Identify varnish precursors through Acid Number (AN) and viscosity monitoring to implement corrective filtration or mitigation before catastrophic failure occurs.
- Establish clear maintenance triggers to determine when critical data necessitates immediate professional actions such as hot oil flushing or vacuum dehydration.
The Anatomy of an Industrial Oil Analysis Report
Think of an oil analysis report as a diagnostic blood test for your machinery. Just as a physician uses blood work to detect systemic issues before they manifest as physical symptoms, maintenance professionals use oil data to identify internal component degradation. Learning how to read an oil analysis report involves moving beyond the “Red, Amber, Green” status lights and understanding the specific chemical and physical markers that define equipment health. A comprehensive oil analysis overview typically categorizes data into four distinct pillars: physical properties, wear metals, contaminants, and additive levels. Each section provides a piece of the puzzle, but they only reveal the full picture when viewed together.
Accuracy begins with the machine information provided to the laboratory. If the lab is unaware of the specific lubricant brand, the component type, or the hours on the oil, their interpretation will be flawed. For instance, a high silicon reading might trigger an alarm for dirt ingress, but if the lab doesn’t know you recently used a silicone-based gasket sealant, they’ll misinterpret the result. Treat the lab’s “Comment” section as an automated starting point rather than the final word. It’s a technical summary generated by software that lacks the operational context of your specific site environment.
Why Consistent Sampling Matters
The quality of your data is entirely dependent on the quality of your sample. If you take a sample from a “dead leg” in the piping or a drain valve where sediment has settled, the results will show an exaggerated level of contamination that doesn’t reflect the circulating oil. Dirty sampling valves are a common culprit for false alarms, often leading to unnecessary downtime. To ensure your laboratory data is actionable, you must follow a rigid protocol for how to take an effective oil sample. Consistency in location and technique allows you to build a reliable trend over time, making it easier to spot genuine anomalies.
The Role of Baseline Data
You cannot determine if your oil is “bad” without knowing what “new” looks like. Every lubricant has a unique chemical signature. Comparing your used oil results against the virgin oil specifications is essential for identifying additive depletion or fluid cross-contamination. While generic industry averages provide a loose guideline, they don’t account for the unique operating temperatures or load profiles of your specific plant. Establishing a baseline for each critical asset allows you to define a “Normal” state. This localized context is what enables you to differentiate between expected break-in wear and a looming catastrophic failure.
Decoding Wear Metals and Elemental Analysis
Wear metal analysis serves as the forensic evidence within your lubrication system. When you are learning how to read an oil analysis report, the elemental analysis section is often where you will spend the most time. This data is typically presented in parts per million (ppm). To put this scale into perspective, 1 ppm is equivalent to a single drop of water in a 50 litre fuel tank. While these numbers seem microscopic, they represent the physical degradation of your internal components. It is vital to distinguish between normal break-in wear, which is common in new or recently overhauled machinery, and accelerated failure. A sudden spike in ppm levels after a period of stability is a clear indicator that the lubrication film has been compromised.
Understanding these values requires a technical baseline. This lubricant analysis guide provides a deeper look into how different machine types produce varying elemental signatures. For those managing critical assets, Ferrography is a specialized analytical technique used to isolate and examine large wear particles under a microscope to determine the specific mode of component failure. This goes beyond simple elemental counts to provide visual confirmation of the wear mechanism.
Common Wear Metals and Their Sources
Different metals correlate to specific internal components, allowing you to narrow down the source of the trouble. Iron (Fe) is the most common element found, usually originating from cylinder liners, gears, or shafts. If Iron levels are rising, it suggests abrasive or adhesive wear on these primary structures. Copper (Cu) often points toward bearings, bushings, or the internal core of oil coolers. Lead (Pb) and Tin (Sn) are typically used in bearing overlays and sacrificial layers; their presence in the oil suggests that the protective surface of the bearing is being stripped away. Monitoring these elements helps you understand how to read an oil analysis report with a focus on component longevity.
Interpreting Multi-Metal Indicators
The true value of elemental analysis lies in the interaction between different markers. If you observe a rise in Iron alongside a rise in Silicon, it is likely that dirt ingress is causing abrasive wear. The Silicon acts as the “cutting tool” that removes Iron from the machine surfaces. Similarly, a simultaneous increase in Copper and Lead is a classic signal of bearing fatigue or chemical corrosion. When these indicators reach critical thresholds, utilizing Filter Ferrogram services can provide the necessary detail to confirm if the wear is benign or catastrophic. If you are unsure about a specific metal trend, seeking an expert review from the team at BioKem Oil Services can help clarify the required maintenance path.
Understanding ISO 4406: Particle Counting and Cleanliness
When mastering how to read an oil analysis report, the ISO 4406 code is the most critical metric for assessing fluid cleanliness. This three digit code represents the quantity of particles per millilitre of fluid at three specific size thresholds: 4 microns, 6 microns, and 14 microns. For example, a code of 18/16/13 tells you exactly how many particles of each size are circulating through your pumps and valves. It is essential to understand that this scale is logarithmic. Every time a value increases by one, the particle count effectively doubles. A system that moves from an ISO code of 17 to 18 is now twice as dirty, significantly increasing the risk of component wear. Approximately 80% of hydraulic system failures are a direct result of this particle contamination.
Setting target cleanliness levels requires a logical assessment of system pressure and component sensitivity. High pressure hydraulic systems with tight tolerance servo valves require much lower codes, often 16/14/11 or better, compared to low pressure industrial gearboxes. While the 4 micron number indicates the overall “silt” load, the 6 micron (middle) number is often the most critical for valve health. Particles in this size range are perfectly sized to jam into the clearances of moving parts, causing erratic operation or total seizure. Understanding how to read an oil analysis report with a focus on these specific thresholds allows you to implement filtration strategies that prevent failure before it starts.
The Impact of Silt and Fine Particulates
Small particles below the threshold of human vision are often the most destructive. These fine silts act as an abrasive slurry, causing a “sandblasting” effect on internal surfaces. This microscopic erosion is a primary cause of hydraulic valve sticking, where silt accumulates in the tight clearances of spool valves. To prevent these failures, maintenance teams should utilize the Particle Pal range for real-time onsite verification. This allows for immediate action and confirms the effectiveness of your current filtration before the next lab report arrives.
Water and Contamination Limits
Water is a secondary but equally dangerous contaminant. It exists in three states: dissolved, emulsified, and free. When oil appears “cloudy,” it has reached its saturation point, and free water is now present. This is a maintenance emergency. Precise measurement requires Karl Fischer (KF) testing, which detects water levels in parts per million rather than simple percentages. Water doesn’t just cause rust; it triggers rapid oil oxidation and additive depletion. This chemical breakdown strips the lubricant of its protective properties, leading to premature fluid failure and increased environmental waste.
Fluid Chemistry: Viscosity, Oxidation, and Varnish Precursors
While previous sections focused on physical contaminants and wear debris, fluid chemistry reveals the metabolic health of the lubricant itself. Viscosity remains the most critical physical property of any industrial oil. It determines the fluid’s ability to maintain a protective film between moving parts under specific loads and temperatures. A significant shift in viscosity, whether an increase due to oxidation or a decrease due to fuel or solvent dilution, signals that the oil can no longer fulfill its primary function. When you are learning how to read an oil analysis report, checking the viscosity against the baseline is your first priority.
The Acid Number (AN) serves as a key indicator of oil life by measuring the concentration of acidic by-products. These acids are formed through oxidation and thermal degradation. Monitoring the AN trend allows maintenance teams to predict when the oil will reach its condemnation limit. Once the AN begins to rise sharply, the oil is entering a phase of rapid deterioration that can lead to sludge formation and corrosive wear on sensitive internal surfaces. This chemical shift is often invisible, occurring even when the oil looks relatively clean to the naked eye.
One of the most deceptive aspects of oil health is varnish potential. Oil can harbor significant levels of sub-micron oxidation by-products that don’t register on standard particle counts. Membrane Patch Colorimetry (MPC) is the gold standard for identifying these varnish precursors. It measures the color intensity of a patch after filtering a specific volume of oil, providing a numerical value for varnish potential. High MPC scores often precede hydraulic valve sticking and heat exchanger fouling, making it a vital metric for proactive reliability.
The Varnish Warning Signs
Interpreting high MPC scores is vital for turbine systems where reliability is non-negotiable. Traditional particle counters often miss varnish precursors because these contaminants are “soft” and typically smaller than 4 microns. If your report shows an MPC score above 30, the system is at risk of deposit formation. Implementing varnish removal systems is the only way to strip these soluble contaminants from the oil and prevent them from plating out on critical components.
Additive Depletion and Oxidation
Additive levels eventually drop as they sacrifice themselves to protect the base oil. RULER testing (Remaining Useful Life Evaluation Routine) monitors antioxidant levels to determine how much protection is left. Without these antioxidants, the oil enters a “death spiral” where heat, oxygen, and metal catalysts accelerate chemical breakdown. In some cases, you can “sweeten” the oil by adding fresh fluid to replenish additives; however, a full oil change is required once the base oil has significantly oxidized. Understanding these chemical shifts is a core part of how to read an oil analysis report for long term asset sustainability.
If your latest report indicates high varnish potential or chemical instability, reach out to BioKem for professional varnish mitigation and oil purification services.
From Data to Action: Corrective Strategies with BioKem Oil Services
Understanding how to read an oil analysis report is only the first step in a comprehensive reliability program. The data remains a static observation until it is translated into a specific maintenance trigger. When a report returns a “Critical” status, often due to a spike in wear metals or an ISO 4406 code that has doubled in particle concentration, immediate intervention is required. In these scenarios, simply changing the oil is a temporary fix that fails to address the underlying contamination within the system’s dead legs and piping. A professional hot oil flushing service is the most effective way to restore system cleanliness by removing the debris that traditional filtration cannot reach.
For systems struggling with high water content identified through Karl Fischer testing, vacuum dehydration offers a sustainable alternative to frequent fluid replacement. This process removes dissolved, emulsified, and free water without damaging the lubricant’s additive package. Maintaining these gains requires the installation of superior hardware. As the sole Australian distributor for Filters S.p.A. products, BioKem Oil Services provides high efficiency filtration solutions that ensure your fluid remains within target cleanliness specifications long after the initial corrective action is complete.
Implementing a Proactive Maintenance Arc
Shifting your operational model from “Fail and Fix” to “Predict and Prevent” requires a consistent analytical approach. BioKem Oil Services’ onsite services are designed to reduce unscheduled downtime by identifying issues like varnish precursors or additive depletion before they cause a trip. Consulting with specialists allows you to interpret complex multi asset reports, ensuring that maintenance budgets are allocated to the assets that pose the highest risk to production. This technical partnership turns a laboratory document into a strategic roadmap for equipment longevity.
Specialist Solutions for Critical Results
Certain systems, such as those utilizing phosphate ester EHC fluids, require specialized maintenance to manage acidity and resistivity. BioKem Oil Services provides dedicated EHC fluid maintenance to prevent the chemical breakdown that leads to servo valve failure. To verify that a system has reached the required cleanliness standard following a maintenance event, we utilize Paddle Flushing Screens. These provide a physical verification of the fluid’s condition, complementing the digital data from the lab. For emergency contamination control, our national equipment hire fleet provides immediate access to the purification technology needed to stabilize your critical assets. Knowing how to read an oil analysis report allows you to deploy these resources with clinical precision.
Advancing Your Asset Reliability Strategy
Mastering the technical nuances of how to read an oil analysis report transforms raw laboratory data into a powerful diagnostic tool. By monitoring the trends within your fluid’s chemical profile and physical cleanliness, you move beyond reactive maintenance. These metrics provide the visibility needed to preserve component integrity and ensure the long-term health of your industrial lubrication circuits. A report is only as valuable as the corrective actions it triggers. Identifying the right intervention is critical for operational success.
BioKem Oil Services serves as your dedicated partner in this reliability journey. As the sole Australian distributor for Filters S.p.A. and onsite industrial oil purification specialists, we provide national coverage for critical asset maintenance. We translate complex data into actionable steps like varnish mitigation or vacuum dehydration. You don’t have to interpret these results alone. Request a Professional Oil Analysis Interpretation & Consultation from BioKem Oil Services to secure the future of your machinery. Proactive fluid management is a commitment to both equipment reliability and environmental sustainability. Your team now has the knowledge to turn industrial oil reports into a distinct competitive advantage.
Frequently Asked Questions
What is the most important number on an oil analysis report?
No single number is universally the most important, as priorities shift based on the asset type. However, viscosity is widely considered the primary indicator of a lubricant’s physical integrity and film-strength capability. For high-pressure systems, the ISO 4406 cleanliness code is equally vital. Understanding how to read an oil analysis report requires looking at the trend of these numbers over time rather than a single data point in isolation.
How often should I perform oil analysis on my hydraulic system?
Critical hydraulic systems typically require sampling every 250 to 500 operating hours or on a monthly basis. Less sensitive systems might move to a quarterly schedule depending on their environment. The goal is to establish a historical trend that allows you to spot anomalies before they result in component failure. High-load environments or those with significant temperature fluctuations may necessitate more frequent testing to ensure the additive package remains effective.
What does a high ISO 4406 code actually mean for my pump life?
A high ISO 4406 code indicates a severe concentration of abrasive particles that will exponentially accelerate pump wear. Because the scale is logarithmic, an increase of just one code number represents a doubling of the contaminant load. This leads to internal leakage, reduced volumetric efficiency, and eventual seizure. Maintaining a target code of 16/14/11 can extend the service life of hydraulic components by up to 300% compared to a dirty system.
Can oil analysis detect a bearing failure before it happens?
Yes, oil analysis is highly effective at detecting early-stage bearing fatigue. As bearings begin to degrade, they shed microscopic wear metals like copper, lead, and tin into the oil. By monitoring these elemental parts-per-million (ppm) levels, you can identify a failing bearing weeks before a catastrophic breakdown occurs. Advanced techniques like ferrogram services provide visual confirmation of the wear particle shape, further narrowing down the specific failure mode.
Why is my oil viscosity decreasing even though I haven’t added any fluid?
A decrease in viscosity without fluid addition usually points to either fuel dilution or mechanical shearing of the lubricant’s viscosity index (VI) improvers. In engines, fuel leakages thin the oil, while in high-shear hydraulic or gear applications, the long-chain polymers in the oil literally break apart. This reduction in film strength increases the risk of metal-to-metal contact, necessitating an investigation into how to read an oil analysis report for root cause identification.
What is the difference between TAN and TBN in oil analysis?
Total Acid Number (TAN) measures the concentration of acidic by-products in the oil, which is a primary indicator of oxidation and fluid aging. Total Base Number (TBN) measures the oil’s alkaline reserve, specifically its ability to neutralize acids. While TAN is the standard for industrial and hydraulic fluids, TBN is critical for internal combustion engines where acidic combustion by-products must be neutralized to prevent corrosive wear on internal surfaces.
How do I know if my oil needs varnish mitigation or just filtration?
Standard filtration removes solid, hard particles, but it cannot capture the soluble “soft” contaminants that lead to varnish. If your report shows an MPC (Membrane Patch Colorimetry) score above 20, you likely need specialized varnish mitigation. While high-quality filters manage the ISO cleanliness code, varnish mitigation systems use specialized mechanisms to remove the sub-micron precursors that plate out on valves and heat exchangers, causing sticking and overheating.
Is onsite oil analysis as accurate as laboratory testing?
Laboratory testing remains the gold standard for precision and comprehensive elemental analysis. However, onsite devices provide immediate and highly accurate results for ISO cleanliness codes and water content. Onsite testing is an excellent tool for real-time verification after a filtration event or hot oil flush, while laboratory reports provide the deep chemical and forensic data needed for long-term reliability planning and regulatory warranty compliance.