

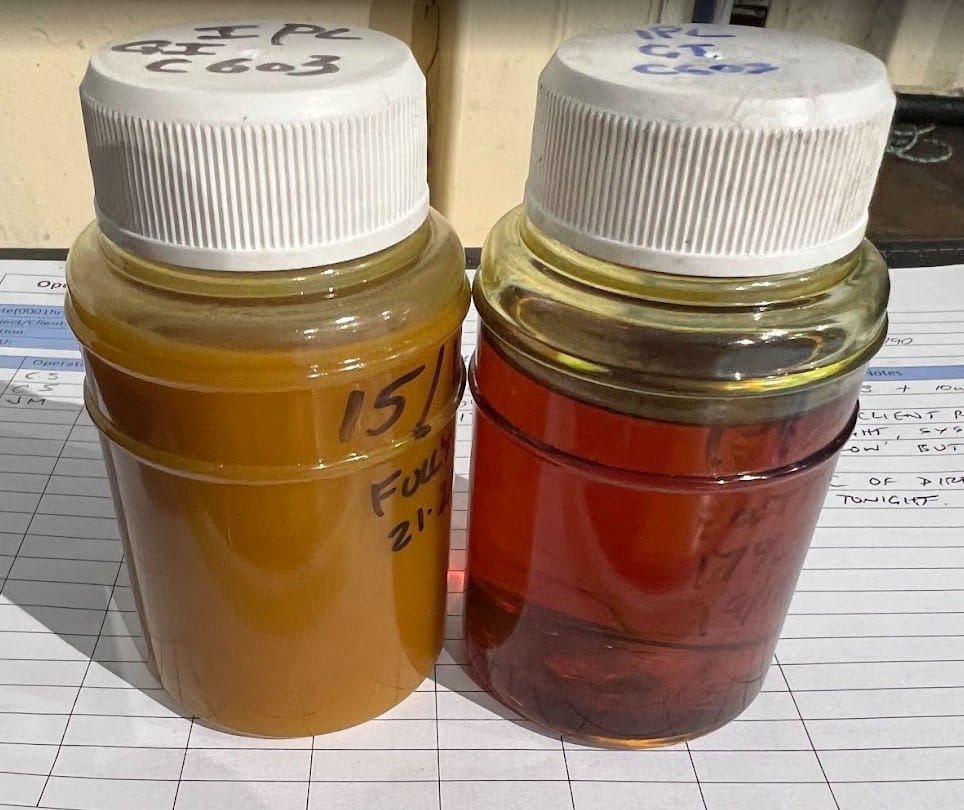
Your latest lab report says “normal,” but the varnish buildup in your turbine tells a different story. It’s a common frustration for reliability teams who feel they’re drowning in data while still facing the high costs of unscheduled downtime. You’ve likely realized that standard testing often misses the subtle chemical shifts that lead to component failure. In a global industrial lubricants market projected to reach $59.98 million in 2026, a sophisticated lube performance analysis is the only way to ensure your assets remain compliant with tightening environmental standards like the EPA’s 9.0 µg/m³ PM2.5 limit.
We agree that you need clear action steps, not just more spreadsheets. This guide shows you how to transform raw data into actionable maintenance strategies that extend equipment life and reduce unscheduled interruptions. We’ll also examine how the new ISO 12940:2026 standards and updated ASTM-26 designations provide a framework for achieving zero lubrication-related shutdowns while securing a clear ROI on your filtration investments.
Key Takeaways
- Transition from reactive oil replacement to proactive, condition-based maintenance by monitoring critical KPIs like ISO 4406 cleanliness and MPC varnish potential.
- Combine onsite diagnostics with laboratory data to bridge the gap between raw reports and immediate, actionable maintenance decisions.
- Identify the specific root cause of contamination to determine whether your system requires high-velocity hot oil flushing or precision purification.
- Utilize a comprehensive lube performance analysis to justify maintenance budgets and secure a clear ROI on filtration investments.
- Enhance operational sustainability by integrating specialist Filters S.p.A. hardware to extend oil life cycles and reduce industrial fluid waste.
What is Lube Performance Analysis in an Industrial Context?
Industrial maintenance has evolved past the era of scheduled oil changes based on arbitrary calendar dates. In a market where power generation alone accounts for 26.6% of lubricant revenue, the cost of inefficiency is too high to ignore. A lube performance analysis is a sophisticated diagnostic bridge that evaluates the chemical health of the fluid alongside the physical condition of the machinery. It moves your strategy from reactive “drain and fill” cycles to condition-based proactive maintenance, ensuring you only intervene when the data dictates it.
While a basic Oil analysis provides a snapshot of the fluid’s current state, a true performance analysis looks deeper into the lifecycle of hydrocarbons and the presence of microbial contamination. Modern industrial systems are increasingly sensitive to the breakdown of base oils. Without monitoring how these fluids perform under high thermal stress, you risk missing the early signs of oxidation that lead to costly varnish. Understanding these technical mechanisms is the first step in protecting your operational bottom line.
To better understand the fundamentals of evaluating your lubricants, watch this helpful video:
The Core Objectives of Performance Diagnostics
The primary goal is to identify early-stage component wear before it triggers a catastrophic failure. By using techniques like analytical ferrography and precise particle counting, reliability teams can spot microscopic metal fragments that signal bearing or gear fatigue. This diagnostic depth also detects the onset of varnish formation, which often remains hidden in standard lab reports until a valve sticks. Maintaining the correct fluid film thickness reduces friction, which directly optimises energy consumption and helps your facility meet tightening environmental standards like the 2024 EPA soot rule.
Beyond the Bottle: System-Wide Analysis
Effective diagnostics don’t stop at the fluid itself. You must evaluate how the lubricant interacts with your entire system, including seals, valves, and heat exchangers. This includes assessing the efficiency of your specialist oil filters to ensure they’re actually capturing the contaminants identified in your reports. By integrating hardware performance with fluid chemistry, you create a feedback loop that justifies maintenance spend through clear ROI. Lube performance analysis is a holistic health check that examines the synergistic relationship between the lubricant, the mechanical components, and the operational environment to ensure long-term industrial asset reliability.
Key Performance Indicators (KPIs) for Lubricant Health
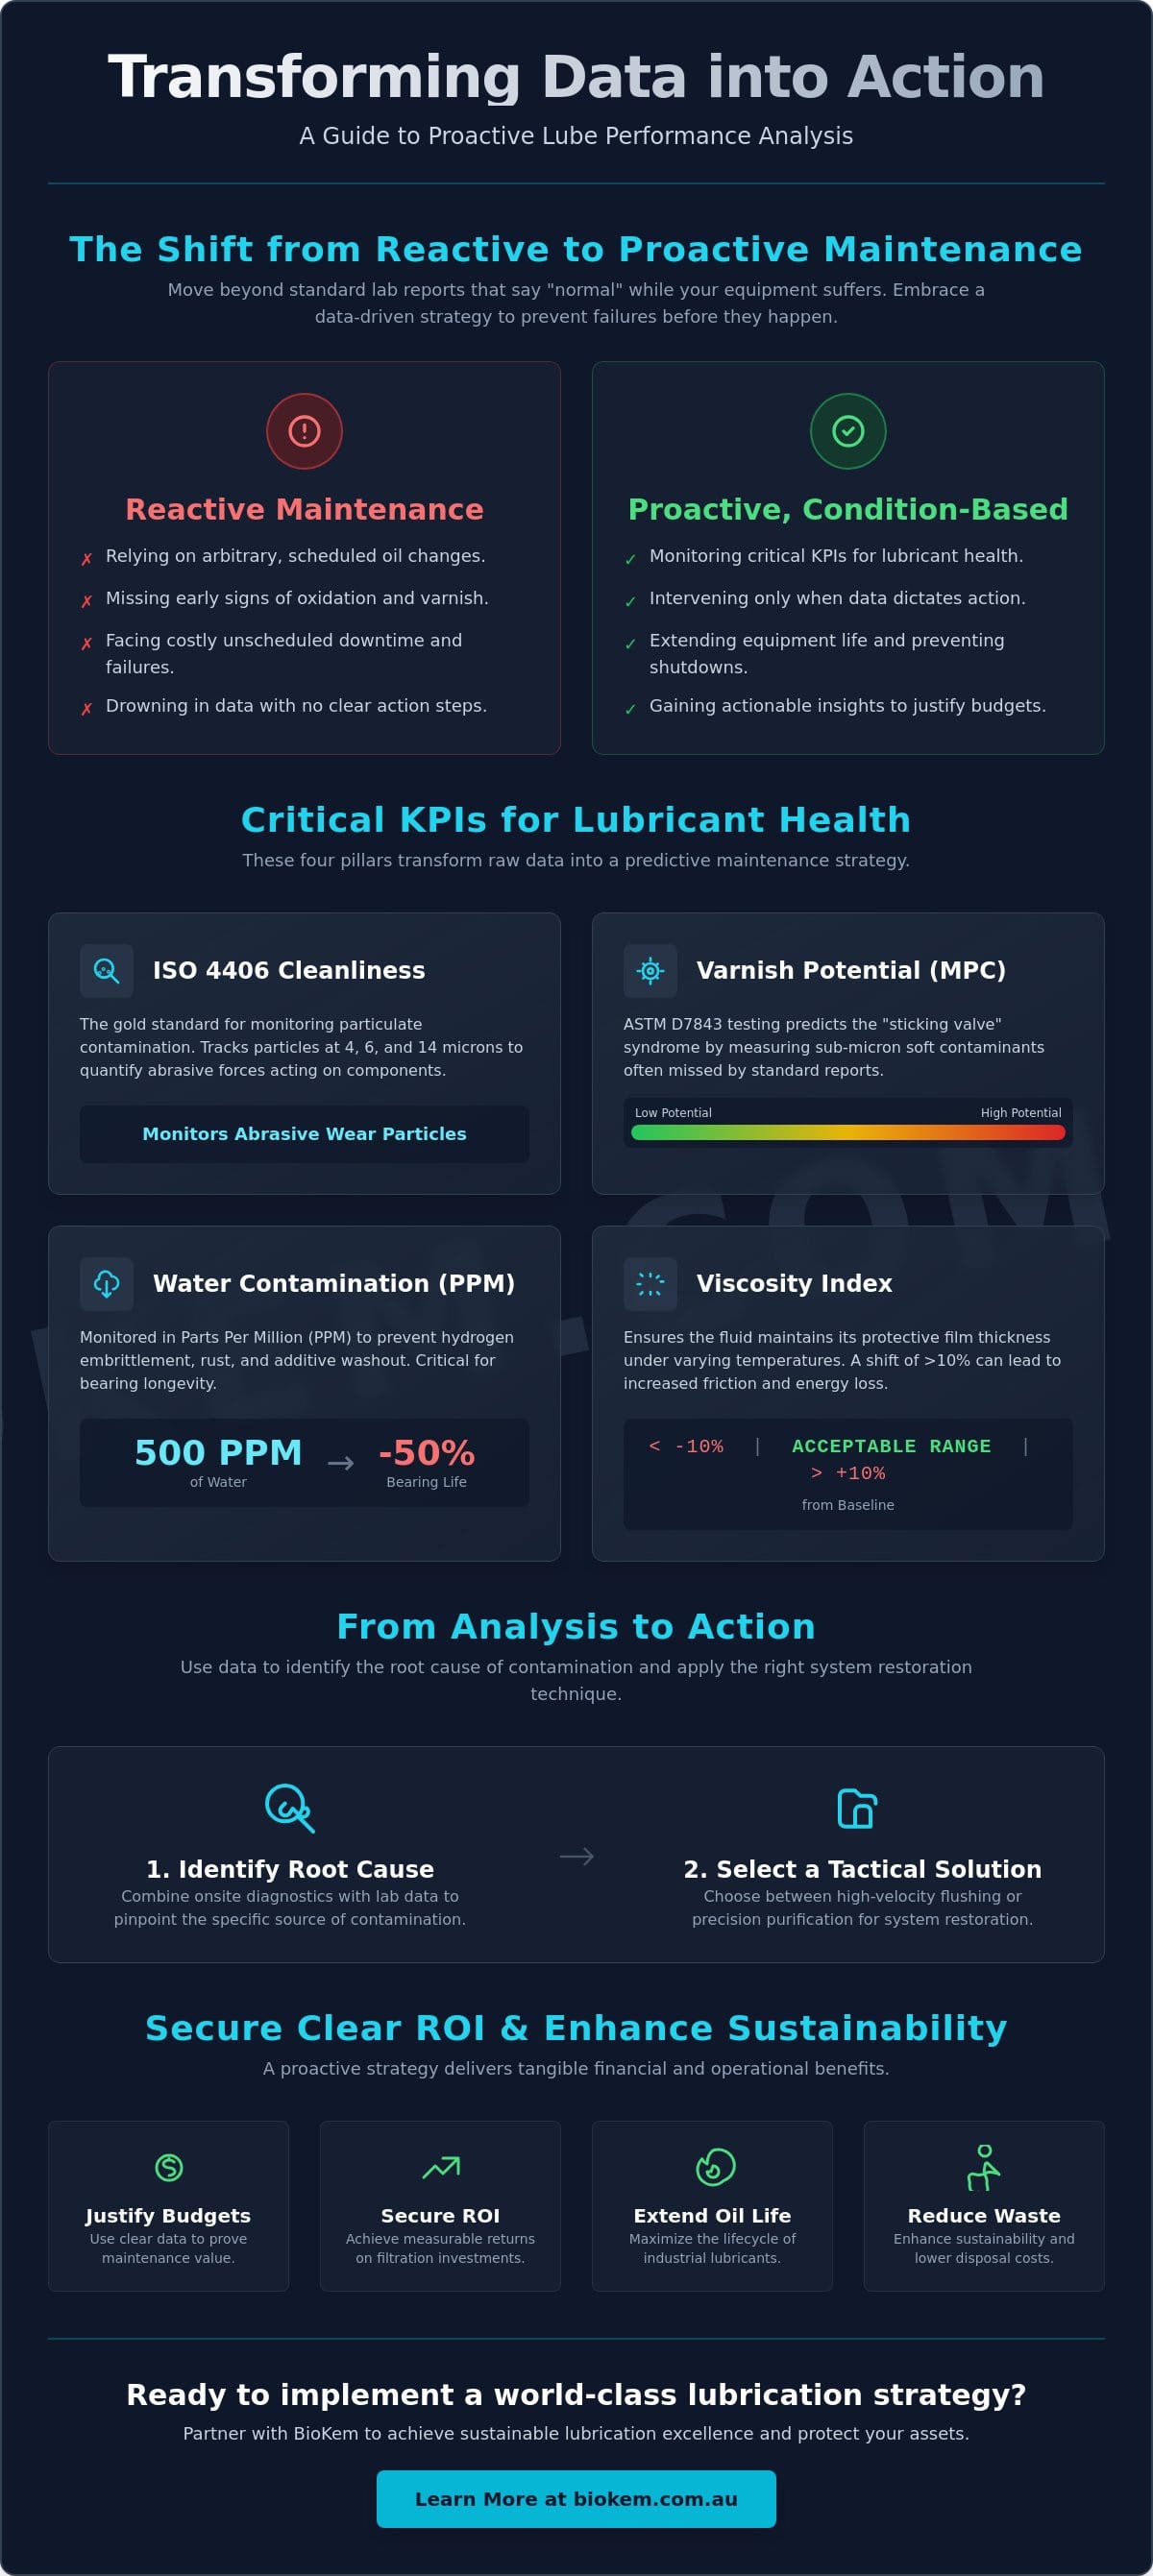
Measuring the right variables transforms raw data into a predictive maintenance strategy that prevents catastrophic failure. A comprehensive lube performance analysis relies on four critical pillars. First, ISO 4406 Cleanliness Codes serve as the gold standard for particulate contamination monitoring. These codes track particles at 4, 6, and 14 microns, providing a clear picture of the abrasive forces acting on your bearings. Second, Varnish Potential, or MPC testing (ASTM D7843), predicts the “sticking valve” syndrome before it occurs. This is vital because standard oil reports often miss the sub-micron soft contaminants that cause servo-valve failure.
Third, water contamination must be monitored in parts per million (ppm) to prevent hydrogen embrittlement and additive washout. Even 500 ppm of water can reduce bearing life by as much as 50 percent in high-speed applications. Finally, the Viscosity Index ensures the fluid maintains its protective properties under varying thermal loads. If the viscosity shifts by more than 10 percent from the baseline, the fluid film thickness is compromised, leading to increased friction and energy loss. Monitoring these KPIs allows you to maintain compliance with evolving standards like the ISO 12940:2026 for grease consistency.
Establishing Baselines and Alarm Limits
Setting realistic targets requires more than just following the generic “caution” or “critical” limits provided by standard laboratory services. You must establish baselines based on OEM specifications and the specific criticality of the asset. A turbine in a power plant requires tighter tolerances than a non-critical conveyor gearbox. Using trend analysis rather than reacting to isolated alarms allows reliability teams to predict failure windows with greater accuracy. This proactive approach ensures that maintenance is performed based on the actual condition of the hydrocarbons, not just a preset schedule.
Integrating OEE with Lubrication Metrics
Linking oil cleanliness directly to Overall Equipment Effectiveness (OEE) statistics provides a clear ROI for your maintenance efforts. When your lubrication metrics improve, you’ll notice a corresponding decrease in unscheduled downtime and a rise in machine availability. This shift often requires a “lubrication cultural change” within the maintenance team, moving away from viewing oil as a consumable and toward treating it as a critical machine component. Implementing advanced fluid management strategies drives these KPIs and ensures long-term reliability. You can explore our specialist lubrication services to see how these metrics are applied in complex industrial environments.
Bridging the Gap: Laboratory Results vs. Onsite Diagnostics
Standard laboratory testing provides a valuable historical record, but it often fails to capture the immediate reality of a high-flow industrial system. Relying solely on offsite reports creates a dangerous lag time, typically spanning three to five business days. During this window, a minor contamination event can escalate into a full system shutdown. A robust lube performance analysis requires a hybrid approach that combines the precision of ISO 17025:2017 accredited labs with the speed of onsite diagnostics. This dual strategy ensures that critical maintenance decisions are based on the fluid’s current state, not its condition from a week ago.
We frequently encounter the “sticking valve” paradox where a facility’s lab reports indicate normal wear levels, yet their turbine or hydraulic systems are failing. This occurs because standard Inductively Coupled Plasma (ICP) spectroscopy is limited to detecting particles smaller than five microns. It effectively ignores the larger, “boulder-sized” wear debris that signals imminent component fatigue. Implementing onsite oil analysis allows reliability teams to bypass these limitations. By performing immediate visual and chemical checks, you can identify the varnish precursors and large particulates that standard reports routinely miss.
Representative sampling is the foundation of this process. In high-flow systems, taking a sample from a dead-leg or the bottom of a reservoir will produce skewed data. Technicians must use live-zone sampling to ensure the fluid reflects the actual operating environment. This accuracy is essential for justifying the ROI on purification hardware and avoiding the high costs of unscheduled downtime.
Advanced Diagnostic Tools
To see what the lab misses, we utilize Filter Ferrograms to extract and analyze large wear debris directly from the system’s filters. This provides a microscopic look at the shape and composition of particles, allowing us to distinguish between normal “break-in” wear and aggressive fatigue. For real-time monitoring, the Particle Pal range offers immediate ISO cleanliness counts and water-in-oil saturation levels. Patch testing then serves as a visual verification, providing a physical “membrane” that proves the presence of varnish or silt to stakeholders who need more than just numbers on a screen.
The Role of Onsite Technicians
Data is only as useful as its interpretation. In Australia, environmental stressors like extreme ambient heat and airborne dust can accelerate hydrocarbon degradation. Expert onsite technicians understand these regional variables and can distinguish between a genuine system fault and a “phantom” alarm caused by poor sampling technique. This local expertise is vital for critical turbine and hydraulic assets, where immediate feedback allows for the tactical deployment of purification units before a failure occurs. This proactive oversight ensures your lube performance analysis remains a dynamic tool for asset reliability rather than a static administrative requirement.
Turning Analysis into Action: Tactical System Restoration
Once your lube performance analysis identifies a deviation from the baseline, the focus shifts from observation to tactical restoration. You must first isolate the root cause. Is the issue a particulate ingress, water contamination, or the onset of chemical oxidation? Identifying the specific contaminant dictates whether you need continuous purification or a more aggressive system-wide intervention. This logical sequence ensures you don’t waste resources on temporary fixes that ignore the underlying mechanical or chemical triggers.
Choosing the right method is critical for maintaining a high ROI on your maintenance budget. Purification, such as vacuum dehydration, effectively manages moisture and minor particulate loads during normal operation. However, when contamination levels exceed the capacity of onsite filters, or when a system is being commissioned, you must execute Hot Oil Flushing. This process uses high-velocity turbulent flow to dislodge and remove sub-micron contaminants that standard filtration cannot reach. Following this, implementing Varnish Mitigation restores the system chemistry by stripping away the polar compounds that cause valve sticking. The final step is always re-analysis to verify that the intervention successfully restored the fluid to its target ISO cleanliness code.
When Analysis Dictates a System Flush
Moving from kidney-loop filtration to a full system flush depends on the particulate concentration and the criticality of the internal clearances. If your lube performance analysis shows a sudden spike in metallic wear debris despite existing filtration, the contaminants are likely settled in low-flow areas of the piping. We use paddle flushing screens to physically verify when the system has reached the required cleanliness. In one instance, early detection of particulate ingress in a power generation facility prevented a turbine failure that would’ve cost over $500,000 in repairs and lost production.
Proactive Varnish Removal
Monitoring Membrane Patch Colorimetry (MPC) trends allows you to time your mitigation before the oil’s solubility limit is reached. It’s vital to distinguish between removing varnish from the oil and removing it from the metal surfaces. Once varnish precipitates onto valves, simply changing the oil won’t solve the issue; the new oil will quickly become contaminated by the existing deposits. This is particularly important for maintaining long-term reliability in heat transfer systems, where carbonaceous deposits can severely impact thermal efficiency. If you’re seeing rising MPC values, you can contact our specialists to develop a tailored restoration plan.
The BioKem Oil Services Approach: Sustainable Lubrication Excellence
BioKem Oil Services defines excellence as the intersection of technical precision and environmental responsibility. As the global industrial lubricants market expands toward a projected 27.95 billion liters by 2031, the ecological footprint of hydrocarbon disposal becomes a critical corporate liability. Our approach integrates lube performance analysis with high-performance hardware from Filters S.p.A. to close the loop on fluid management. By treating oil as a long-term asset rather than a consumable, BioKem Oil Services helps facilities reduce their waste output and maintain compliance with Australian environmental standards.
Our “green” problem-solving philosophy differs from competitors who rely on generic CO2 calculators. BioKem Oil Services provides the physical mechanism for sustainability through scientific purification and varnish mitigation. This ensures your facility meets the 9.0 µg/m³ PM2.5 soot standard while simultaneously lowering the total cost of ownership. We don’t just track efficiency; we engineer it into the fluid’s lifecycle.
Expertise in Critical Asset Management
BioKem Oil Services is the trusted partner for oil contamination control because we combine laboratory precision with onsite technical muscle. As an Australian-owned specialist, we possess a deep understanding of local regulatory requirements and the unique environmental stressors of the region. We don’t just hand you a report; we deploy the specific equipment, from vacuum dehydration units to specialized flushing rigs, needed to correct the deviations identified in your lube performance analysis. This local expertise anchors our scientific aspirations in a dependable, regional context.
Long-Term Asset Longevity
Designing a proactive maintenance strategy based on performance data is the only way to achieve true asset longevity. Professional analysis and targeted purification can extend oil life cycles by up to 300 percent, significantly deferring the costs associated with new fluid procurement and disposal. This data-driven roadmap ensures your equipment operates at peak efficiency for its entire design life. While analysis provides the roadmap, BioKem Oil Services serves as the vehicle for total system reliability and long-term ecological health.
Securing the Future of Your Industrial Assets
Reliability is no longer about the volume of data collected; it’s about the precision of the response. Moving beyond the “normal” lab report requires a lube performance analysis that prioritizes the physical reality of your machinery over generic spreadsheets. By integrating onsite diagnostics with tactical restoration, you eliminate the guesswork that leads to unscheduled shutdowns and premature component fatigue. This proactive oversight preserves your hydrocarbons and ensures your facility remains a leader in both operational efficiency and environmental compliance.
BioKem Oil Services has been Australian-owned and operated since 2011, serving as a dedicated partner in solving complex lubrication challenges. As the Authorized Australian Distributor for Filters S.p.A., we provide the technical expertise and specialized hardware required for high-velocity hot oil flushing and precision varnish mitigation. We help you transform raw oil data into a sustainable roadmap for system-wide reliability.
Optimise your asset reliability with BioKem Oil Services’ expert analysis services. Take control of your lubrication strategy and secure the long-term health of your critical industrial infrastructure today.
Frequently Asked Questions
What is the difference between standard oil analysis and lube performance analysis?
Standard oil analysis typically provides a snapshot of fluid properties like viscosity and elemental wear at a specific moment. A lube performance analysis goes deeper by acting as a diagnostic bridge between fluid chemistry and mechanical health. It includes advanced testing like Membrane Patch Colorimetry and analytical ferrography to identify sub-micron contaminants that standard reports often miss. This holistic approach allows reliability teams to understand how the lubricant interacts with system components under real-world thermal stress.
How often should industrial lube performance analysis be conducted?
Frequency depends on the criticality of the asset and the severity of the operating environment. Critical turbine and hydraulic systems in high-dust Australian sectors often require monthly analysis to ensure early detection of varnish. Less critical gearboxes might only need quarterly checks. For assets where downtime costs exceed $10,000 per hour, integrating real-time particle monitoring with monthly deep-dive reports provides the best protection against unscheduled interruptions.
Can lube performance analysis predict a bearing failure before it happens?
Yes, by utilizing analytical ferrography and precise particle counting, technicians can identify large wear debris that signals imminent component fatigue. Standard spectroscopy often misses particles larger than 5 microns, which are the primary indicators of aggressive wear. A comprehensive lube performance analysis spots these metallic fragments early. This allows maintenance teams to schedule repairs during planned outages rather than reacting to a catastrophic failure in the middle of a production cycle.
What is MPC testing, and why is it critical for turbine oil analysis?
Membrane Patch Colorimetry (MPC), governed by ASTM D7843, measures the potential for a lubricant to form varnish. It’s critical for turbine oil because it detects insoluble polar compounds that cause servo-valves to stick and heat exchangers to lose efficiency. Since standard reports might show “normal” wear while varnish is actively precipitating, MPC testing is the only reliable way to predict and prevent the “sticking valve” syndrome before it triggers a system trip.
How does water contamination affect lube performance analysis results?
Water contamination triggers base oil oxidation and additive washout, which can lead to inaccurate viscosity readings and accelerated component wear. Even a concentration of 500 ppm can reduce bearing life by as much as 50 percent in high-speed industrial applications. When analysis identifies rising moisture levels, it’s a clear signal that the system requires vacuum dehydration to restore the lubricant’s dielectric and protective properties before permanent damage occurs.
Is onsite oil analysis as accurate as laboratory testing?
Onsite analysis provides immediate, actionable data that’s essential for rapid decision-making, while ISO 17025 accredited laboratories offer higher precision for trace element detection. The most effective reliability strategies use onsite tools for real-time ISO cleanliness counts and moisture checks. This immediate feedback loop allows technicians to catch contamination events as they happen, while monthly lab reports provide the long-term trend data needed for strategic planning.
What are the most common contaminants found in Australian industrial systems?
Airborne silica (dust) and moisture from high humidity are the leading external contaminants in the Australian industrial landscape. Internally, systems frequently struggle with soft contaminants like varnish and metallic wear particles generated by high thermal loads. These contaminants often work together to accelerate hydrocarbon degradation. Managing these specific threats requires a combination of high-efficiency filtration and specialized purification techniques tailored to regional environmental stressors.
How do I justify the cost of advanced ferrography to management?
Justify the investment by highlighting the ROI of preventing a single unscheduled shutdown. One prevented turbine failure can save a facility over $500,000 in repair costs and lost production revenue. Advanced ferrography provides the technical “smoking gun” that standard tests miss, allowing for surgical maintenance interventions. It moves the budget from a reactive expense category to a proactive insurance policy that secures the long-term health of your most expensive industrial assets.