

What if the "Normal" status on your latest laboratory report is actually masking a catastrophic failure in progress? Many reliability managers feel a sense of unease when they receive "Caution" flags that lack a clear root cause analysis. It’s difficult to interpret complex chemical data when you’re focused on keeping production lines moving. This article uncovers the Top 10 Findings Hidden in Oil Analysis Reports that signal impending equipment failure long before your physical alarms trigger.
We understand that deciphering numerical tables can be overwhelming, especially when subtle signs of varnish and oxidation are missed until valves start sticking. By learning to identify these hidden signals of system degradation, you can justify the cost of advanced filtration or specialised flushing services. This guide provides the technical expertise needed to move beyond basic monitoring. We’ll examine how updated standards like EN ISO 20815:2026 and precision data from ISO 4259-1:2026 help you optimise your proactive fluid management and significantly reduce unscheduled downtime.
Key Takeaways
- Learn why standard status lights often fail to capture the full picture and why establishing a baseline is critical for asset reliability.
- Identify physical contamination risks that standard tests miss, including the “blind spots” in wear metal counts and particle size distribution.
- Discover the Top 10 Findings Hidden in Oil Analysis Reports that expose chemical degradation through advanced MPC and RULER testing.
- Understand why traditional “drain and fill” methods are insufficient and how to select the right technical intervention, such as vacuum dehydration or hot oil flushing.
- Shift from reactive sampling to a proactive strategy that utilises specialised filtration hardware to maintain system health and environmental standards.
The Anatomy of a Modern Industrial Oil Analysis Report
Most industrial operators rely on the traffic light system: green is good, yellow is caution, and red is a crisis. This binary approach overlooks the technical nuance required for true reliability. While a laboratory technician might mark a sample as "Normal," the raw numerical data often tells a different story. Oil analysis is a diagnostic science that requires context to be effective. Relying solely on automated summaries is a common pitfall that hides the Top 10 Findings Hidden in Oil Analysis Reports from decision-makers.
To better understand how data shifts over time, watch this helpful video on the power of trend analysis:
Establishing a baseline for every unique asset is non-negotiable. Without a known starting point, you can’t distinguish between expected break-in wear and an accelerating failure mode. In high-duty cycle hydraulic systems, "Normal" results are particularly misleading. A single-point snapshot might show acceptable ISO codes, but it fails to capture the cumulative degradation that leads to varnish. Identifying the Top 10 Findings Hidden in Oil Analysis Reports requires looking at the rate of change rather than just the current value.
Beyond the Laboratory Comments
Automated laboratory comments are designed for high-volume processing and often miss specific industrial root causes. These generic alerts don’t account for your specific operational environment or duty cycle. To gain a deeper understanding, we recommend performing a professional Filter Debris Analysis alongside fluid reports. This allows you to differentiate between the health of the lubricant itself and the actual mechanical health of the machine components. Understanding this distinction is vital for proactive fluid management.
The Criticality of Metadata
Data is only as good as the metadata accompanying the sample. If the "Hours on Oil" field is incorrect, your wear rate calculations become invalid. A sample taken from a dead-leg pipe rather than a turbulent flow zone will provide skewed results. Similarly, if you’ve recently topped up the system with fresh fluid, your additive concentration readings will appear artificially high, potentially masking a depletion issue. Verifying sample point integrity is the first step in ensuring your report reflects reality.
Top 5 Hidden Signals of Physical Contamination
Standard laboratory reports often show acceptable numbers while masking severe physical threats. Understanding what lies beneath the surface data is essential, which is why these anomalies are core to the Top 10 Findings Hidden in Oil Analysis Reports. Physical contaminants don’t just exist; they evolve and move through your system in ways that basic testing fails to track.
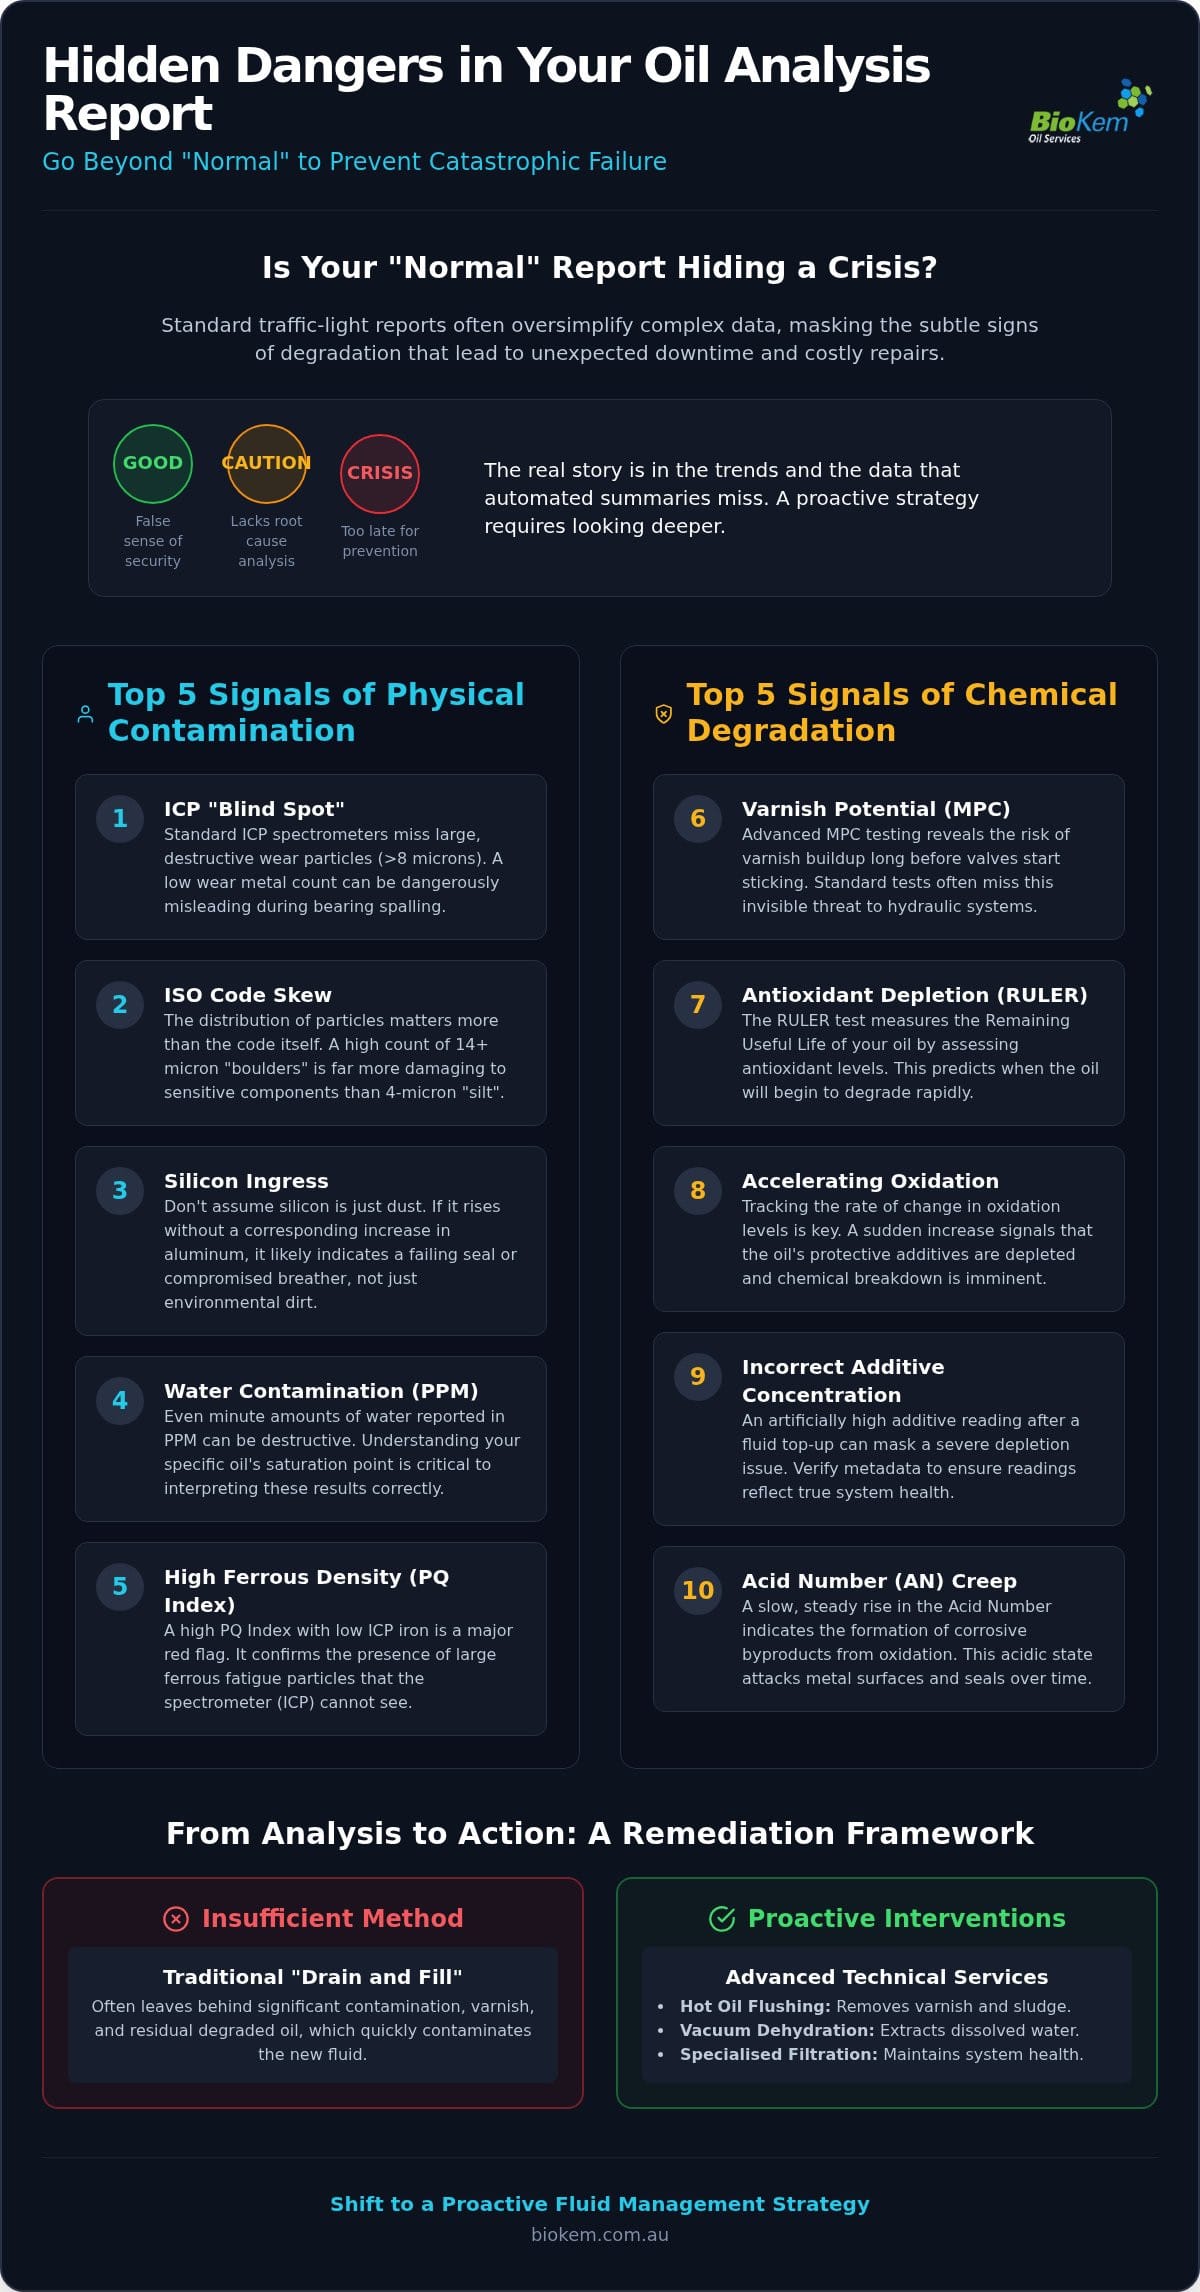
The first major signal is the ICP "Blind Spot." Inductively Coupled Plasma (ICP) spectrometers typically only detect particles smaller than 8 microns. If a bearing is spalling and generating large fatigue chunks, your wear metal count might remain deceptively low while the system is failing. This is a critical entry in the Top 10 Findings Hidden in Oil Analysis Reports because it gives operators a false sense of security.
ISO Code Skew is another hidden indicator. The ISO 4406 code provides three numbers, but the distribution is what matters. High counts in the 14-micron range (the "boulders") are far more damaging to sensitive hydraulic valves than a high count of 4-micron "silt." You must also look for Silicon Ingress. Don’t assume silicon is just environmental dust; if levels rise without a corresponding increase in aluminium, it’s likely a failing seal or a compromised breather.
Water is often reported in parts per million (PPM) because even minute amounts are destructive. While EPA measurement methods provide a scientific framework for fluid precision, interpreting these results requires knowing your oil’s specific saturation point. Finally, use Ferrous Density (PQ Index) to find large-scale fatigue wear. A high PQ Index combined with low ICP iron confirms that large ferrous particles are present, which the spectrometer cannot see.
The Particle Count Paradox
A stable ISO code can hide a dangerous increase in 14-micron particles. If the 14-micron count increases even slightly while the smaller counts remain steady, you’re facing a high-risk scenario. Using Particle Pal ranges allows for real-time verification of these trends on-site, providing immediate data on particle shape. Long, curly ribbons indicate cutting wear, whereas chunky, angular particles point to fatigue.
Moisture: The Silent Catalyst
Research indicates that just 500 ppm of water can reduce bearing life by 50% without any visible change in oil colour. You must identify whether the source is a leaking cooler or atmospheric ingression through poor tank venting. The saturation point where dissolved water becomes free water varies significantly based on the base oil chemistry and operating temperature. If you’re seeing these moisture anomalies, consider a hot oil flushing or vacuum dehydration service to restore system integrity.
Top 5 Hidden Signals of Chemical Degradation
While physical particles cause abrasive wear, chemical degradation destroys the lubricant’s fundamental ability to protect machinery. These chemical shifts represent the final five of the Top 10 Findings Hidden in Oil Analysis Reports. They often occur at a molecular level, remaining undetected by standard viscosity or wear metal tests until the damage to internal components is irreversible.
One of the most deceptive anomalies is viscosity "masking." This happens when fuel dilution, which thins the oil, and oxidation, which thickens it, occur simultaneously. The resulting viscosity reading appears stable, yet the oil is severely compromised. Similarly, a stable Acid Number (AN) can be misleading. AN is a lagging indicator; significant oxidation and sludge formation often occur well before the acid levels spike. Detecting these Top 10 Findings Hidden in Oil Analysis Reports requires advanced diagnostics like RULER testing and MPC.
- MPC (Membrane Patch Colorimetry): This is the only reliable method to quantify "invisible" varnish potential before it plates out on metal surfaces.
- RULER Testing: By measuring the concentration of specific antioxidants, you can predict exactly when the oil will hit its "end of life" cliff.
- Flash Point Drops: A sudden decrease in flash point is a primary indicator of light-end hydrocarbon contamination or solvent ingress in industrial sets.
Varnish: The Invisible Production Killer
Standard laboratory reports frequently miss the chemical precursors to hydraulic valve sticking. Varnish forms when oxidation by-products become insoluble and precipitate out of the fluid. We interpret MPC ΔE values to determine the severity of this risk. A ΔE value above 30 indicates a high potential for varnish, necessitating immediate mitigation. This degradation is often accelerated by thermal sparking, where static discharge across filters creates sub-micron carbon soot that acts as a catalyst for further oxidation.
The Additive Depletion Curve
Proactive fluid management requires monitoring the depletion of Phenolic and Aminic antioxidants. Once these additives are exhausted, the base oil is left unprotected, leading to rapid degradation. In high-index hydraulic fluids, shear-thinning can also occur over time, reducing the oil’s load-carrying capacity. We also watch for "Additive Dropout" in stagnant zones of the system, such as large reservoirs or dead-leg piping. When additives fall out of suspension, they can no longer protect the metal surfaces, even if the bulk oil sample appears healthy.
From Analysis to Action: A Remediation Framework
Once you identify the Top 10 Findings Hidden in Oil Analysis Reports, the focus must shift from diagnosis to effective remediation. A common industry error is the "drain and fill" approach. This method is rarely the answer for contaminated industrial systems because a significant volume of the old, degraded fluid remains trapped in dead-legs, actuators, and long pipe runs. Simply adding fresh oil to a contaminated system results in immediate cross-contamination, often invalidating the new lubricant’s additive package within hours. To restore system integrity, you must align the laboratory findings with a technical intervention that addresses the root cause.
Achieving your Target Cleanliness Levels requires high-performance Filters S.p.A. hardware. These components are designed to capture the specific particle sizes that standard filters bypass. By setting realistic targets based on component sensitivity, you can optimise the life of your assets and ensure that your next report reflects a truly healthy system. Proactive fluid management is about maintaining these targets through consistent, specialised care rather than waiting for a failure to occur.
When to Deploy Hot Oil Flushing
Data showing high ISO codes or significant particulate ingress after a major component failure typically justifies a Hot Oil Flush. This intervention is also critical during new commissioning to remove "built-in" contaminants like welding slag or scale. We utilise Paddle Flushing Screens to physically verify system cleanliness post-service, providing a layer of certainty that fluid analysis alone cannot offer. The long-term cost-benefit of flushing far outweighs the expense of repeated component failures and unscheduled downtime.
Managing Moisture and Varnish Onsite
Vacuum dehydration is the primary solution for reports indicating high PPM water levels. This process removes dissolved water that traditional filters cannot touch, preventing the chemical hydrolysis of your base oil. For systems exhibiting high MPC scores, specialised varnish mitigation is necessary to prevent valve sticking in turbine and EHC fluids. Kidney-loop filtration systems are highly effective at reducing MPC scores by removing the insoluble oxidation by-products that lead to varnish formation. If your analysis indicates critical levels of contamination, contact us to discuss our onsite remediation capabilities.
Optimising Reliability with BioKem’s Integrated Solutions
BioKem Oil Services bridges the gap between laboratory data and operational results. Identifying the Top 10 Findings Hidden in Oil Analysis Reports is the diagnostic starting point, but true value lies in the technical execution that follows. We provide a closed-loop reliability strategy that integrates advanced analysis with onsite technical services. This approach ensures that findings aren’t just noted but corrected through targeted intervention. By extending the service life of your lubricants through purification and specialised filtration, we significantly reduce the environmental footprint of your operations. It’s a steady, logical progression from data to sustainability.
Our national Australian expertise allows us to anchor global lubrication standards in a local context. We understand the specific challenges of the Australian industrial environment, from extreme thermal loads to high particulate ingress. This local knowledge ensures that our interpretations of your reports are practical and actionable. We don’t just look at the numbers; we look at the machine in its environment. This ensures that the Top 10 Findings Hidden in Oil Analysis Reports lead to meaningful improvements in uptime and asset longevity.
Strategic Lubrication Management
Developing a site-wide sampling and analysis program is the foundation of reliability-centred lubrication (RCL). This transition for critical assets involves more than just periodic testing; it requires a disciplined approach to fluid health and contaminant exclusion. For systems facing short-term contamination "shocks" or post-failure debris, we offer specialised equipment hire. This allows you to deploy high-capacity filtration or vacuum dehydration units to stabilise a system without the immediate capital expense of permanent hardware. It’s an efficient way to manage fluid health during maintenance turnarounds or commissioning phases.
Your Partner in Fluid Health
We interpret every report through the lens of Australian industrial reality. As the distributor for Filters S.p.A., we provide access to high-performance filtration products that meet the rigorous demands of heavy industry. Our onsite technical deployment teams are equipped to handle everything from tank cleaning to complex varnish mitigation. We don’t just identify the problem; we provide the specialised hardware and expertise to solve it. This integrated approach ensures your fluid remains within the target cleanliness specifications required for modern, high-pressure systems.
If you’re overwhelmed by complex data or receiving "Caution" flags without a clear path forward, our team is ready to assist. Contact BioKem Oil Services for a professional review of your latest oil analysis report and discover how to turn your data into a reliability advantage.
Transitioning from Reactive Data to Strategic Machine Reliability
Effective fluid management requires more than just collecting samples; it demands a deep understanding of the anomalies that standard laboratory comments often overlook. By identifying the Top 10 Findings Hidden in Oil Analysis Reports, you can move beyond the limitations of simple traffic-light status updates. We’ve explored how subtle signals like MPC ΔE values and ICP blind spots provide the critical lead time necessary to prevent catastrophic component failure. True reliability is achieved when these diagnostic insights are paired with technical interventions like specialised varnish mitigation or vacuum dehydration. It’s a proactive approach that prioritises asset health over reactive repairs.
BioKem Oil Services stands as the sole Australian distributor for Filters S.p.A. hardware, providing the high-performance tools required to maintain your target cleanliness levels. Our team specialises in high-velocity hot oil flushing and varnish mitigation, ensuring your systems operate at peak efficiency while extending lubricant life for better environmental outcomes. Don’t let hidden contamination dictate your maintenance schedule.
Optimise your asset reliability with BioKem’s expert oil analysis and technical services.
Taking control of your fluid health today ensures a more predictable and productive operation tomorrow.
Frequently Asked Questions
How often should I perform oil analysis on critical industrial assets?
Monthly sampling is the standard for critical industrial assets like turbines and high-pressure hydraulic systems. This frequency allows you to establish a baseline and identify the Top 10 Findings Hidden in Oil Analysis Reports before they escalate into failures. For less critical equipment, quarterly testing may suffice. The goal of reliability-centred lubrication is to catch trends early, ensuring that your proactive fluid management prevents unscheduled downtime and extends the service life of your lubricants.
Why did my oil analysis report come back "Normal" but my pump failed?
Pumps often fail despite "Normal" reports because standard ICP testing cannot detect particles larger than 8 microns. This "blind spot" means large fatigue chunks or spalling debris go unnoticed while the report remains green. You must also look for trends rather than single snapshots. A sudden shift within the "Normal" range often signals an impending failure that automated laboratory comments miss. Integrating Filter Debris Analysis (FDA) helps capture these larger, destructive contaminants.
What is the difference between ISO 4406 and Particle Count?
ISO 4406 is the international standard used to classify fluid cleanliness, while particle count refers to the raw data used to generate that code. The ISO code provides three numbers representing particles larger than 4, 6, and 14 microns. The particle count gives the specific number of particles per millilitre at those sizes. Understanding the distribution of these particles is vital for identifying whether you’re dealing with fine silt or damaging "boulders" in your system.
Can oil analysis detect varnish before it causes valve sticking?
Yes, oil analysis can detect varnish precursors through Membrane Patch Colorimetry (MPC) testing. Standard reports often miss varnish because it is a chemical degradation product rather than a physical wear metal. MPC measures the insoluble contaminants that lead to varnish formation. By monitoring MPC ΔE values, you can implement varnish mitigation systems long before you experience valve sticking or overheating. This proactive approach is essential for maintaining EHC fluids and turbine oil integrity.
Is it better to use an onsite patch test or a laboratory report?
You should use both onsite patch tests and laboratory reports for a closed-loop reliability strategy. Onsite patch tests provide immediate qualitative results, allowing technicians to see physical debris and varnish potential in real-time. Laboratory reports offer precise quantitative data and chemical analysis that field tests can’t replicate. Using onsite testing for daily monitoring and laboratory analysis for monthly trends ensures you don’t miss the Top 10 Findings Hidden in Oil Analysis Reports.
What should I do if my report shows a sudden spike in Silicon?
A sudden spike in silicon usually indicates a failure in your contaminant exclusion methods, such as a compromised breather or a failing seal. You should first check if aluminium levels have also risen; if so, the cause is likely environmental dust ingression. If silicon rises alone, it may be due to a recent top-up with an oil containing anti-foam additives or a failing internal seal. Promptly inspect all entry points to prevent abrasive wear.
Does a high Acid Number (AN) always mean I need to change the oil?
A high Acid Number (AN) indicates that the oil is oxidising, but it doesn’t always necessitate an immediate oil change. You should first evaluate the MPC and RULER results to determine the extent of additive depletion and varnish potential. In many cases, you can restore fluid health through specialised purification services like varnish mitigation or vacuum dehydration. This extends the lubricant’s life, reduces waste, and avoids the high cost of a full system drain and fill.
How do I take a representative oil sample for the best results?
You must take samples from a turbulent flow zone, such as an elbow in the return line, while the machine is at normal operating temperature. Avoid sampling from "dead-legs" or the bottom of reservoirs, as these areas collect stagnant debris that isn’t representative of the circulating oil. Use a primary sampling valve and always flush the port with at least ten times the dead-space volume before collecting the final sample to ensure accuracy.