

A “Normal” status on your laboratory spreadsheet is often the most dangerous piece of information you can receive. It creates a false sense of security, while subtle, trending shifts in your machinery’s health go unnoticed. Understanding how to read an oil analysis report is not about glancing at a green flag; it’s about interpreting the diagnostic narrative hidden within the delta between samples. We understand the data overload that comes with modern industrial maintenance. It’s difficult to decide whether a spike in particulates requires immediate vacuum dehydration or if it’s simply a result of recent operational changes.
This guide provides a professional framework to help you master these complexities. You’ll gain the technical expertise needed to justify maintenance budgets for oil purification and reduce unscheduled downtime by spotting failure patterns early. We’ll explore the critical indicators of wear and chemistry, incorporating the latest ISO 4259-1:2026 precision data and the July 2026 API standards to ensure your interpretation remains globally compliant and technically accurate.
Key Takeaways
- Identify the three diagnostic pillars—wear, contamination, and fluid chemistry—to understand the holistic health of your industrial machinery.
- Learn how to read an oil analysis report by focusing on multi-sample trending rather than isolated data points to identify accelerated wear patterns.
- Distinguish between internal wear metals and external ingress to determine if your system requires specific remediation like vacuum dehydration or specialist oil filters.
- Move beyond simple oil changes by using laboratory data to justify professional interventions such as hot oil flushing or varnish mitigation.
- Align your maintenance schedule with current 2026 ISO and API standards to ensure regulatory compliance and long-term operational efficiency.
The Fundamentals of Industrial Oil Analysis Reports
Effective industrial maintenance relies on data over guesswork. Oil analysis serves as the “blood test” for your machinery, providing a non-invasive window into the internal condition of critical components. It’s a proactive maintenance tool used to monitor lubricant health and machine wear before catastrophic failure occurs. By examining a small fluid sample, operators can detect microscopic changes in the system long before physical symptoms appear.
When learning how to read an oil analysis report, you must focus on three primary pillars: Wear, Contamination, and Fluid Chemistry. Wear data tracks metal particles shed from internal components. Contamination identifies external substances like water, dust, or incorrect fluids. Chemistry monitors the degradation of the oil itself, including oxidation and additive depletion. Most reports follow a logical layout, starting with a Header for metadata, followed by an Executive Summary, and concluding with detailed Data Tables.
To better understand this concept, watch this helpful video:
Wear analysis often utilizes Atomic Emission Spectroscopy to identify specific metals like iron, copper, or lead. Contamination monitoring includes checks for moisture, which can lead to rapid oxidation and component corrosion. Fluid chemistry focuses on the Acid Number (AN) or Base Number (BN) and viscosity. Together, these metrics provide a comprehensive view of whether the oil can still protect the machine. Understanding these fundamentals is the first step in mastering how to read an oil analysis report effectively.
Identifying Sample and Machine Metadata
Accuracy begins with the metadata. If the machine hours or oil hours are incorrect, the lab can’t accurately calculate wear rates. You must verify that the lubricant brand and grade listed match what’s actually in the sump. Small errors here lead to “Normal” flags for the wrong oil type. Consistency in the sample point is equally vital; taking a sample from a drain port one month and a reservoir the next destroys your data integrity. For those looking for deeper wear insights, a filter ferrogram can provide additional clarity on particle morphology.
The Executive Summary and Lab Comments
The first thing most managers see is the color-coded flag. A “Condition Red” indicates a critical deviation requiring immediate action, while “Condition Amber” suggests a trend worth monitoring. However, you shouldn’t rely solely on these automated alerts. Always read the technician comments first. Lab technicians often provide specific context that automated algorithms miss, such as noting a specific type of crystalline silica that points to a failing seal. This human insight is what separates a basic data sheet from a professional diagnostic tool. It’s the difference between a simple oil change and a necessary system remediation.
Analysing Wear Metals and Spectrometric Data
Spectrometric analysis forms the technical backbone of most laboratory data. Laboratories typically employ Atomic Emission Spectroscopy (AES) to quantify elemental concentrations in parts per million (ppm). This process involves energizing the oil sample to emit light at specific wavelengths, identifying the presence of distinct metals. However, a significant limitation exists. AES only detects particles smaller than 10 microns in size. If a component is undergoing severe fatigue and shedding larger debris, the spectrometric results might remain within “normal” limits while the machine faces imminent failure.
True expertise in how to read an oil analysis report involves distinguishing between expected break-in wear and accelerated degradation. Normal wear is a steady, linear progression of metal accumulation. Accelerated wear appears as a sharp deviation from the established baseline. When you see a sudden spike in metal concentrations, it indicates a change in the mechanical environment, such as increased load or inadequate lubrication. For those managing critical assets where large particles are a concern, a filter ferrogram provides the necessary visual confirmation that spectrometry cannot offer.
Common Wear Metals and Their Sources
Each metal detected serves as a diagnostic marker for specific internal components. Understanding these sources allows for targeted inspections. Common indicators include:
- Iron (Fe): Typically originates from gears, shafts, and cylinder liners. It is the most common wear element.
- Copper (Cu) and Lead (Pb): These often signal the degradation of bronze or brass bushings, main bearings, and thrust washers.
- Chrome (Cr) and Aluminium (Al): High levels often point toward piston, ring, or turbocharger housing issues.
Additive Levels and Depletion Monitoring
Deciphering Contamination and Fluid Chemistry
Contamination represents the most significant threat to hydraulic system longevity. While wear metals provide a historical record of component degradation, contamination metrics offer a forward-looking view of potential risks. When you’re determining how to read an oil analysis report, you must distinguish between internal wear and external ingression. Internal contaminants are generated by the machine itself, such as metal shards from a failing bearing. External contaminants, like silicon (dust) or moisture, enter through seals or breathers. Identifying these sources early allows for targeted remediation, such as tank cleaning or the installation of more efficient breathers.
Viscosity remains the most critical physical property of any lubricant. Most industrial reports measure kinematic viscosity at 40°C, though 100°C is often used for high-temperature applications. A significant drop in viscosity might indicate fuel dilution or the addition of an incorrect, lighter fluid. Conversely, a rise often signals advanced oxidation or the presence of soot and insoluble contaminants. Beyond physical thickness, we must monitor chemical stability through oxidation and nitration. These values measure the chemical life of the lubricant; high oxidation indicates that the oil is reaching the end of its functional lifespan and may soon begin to form sludge.
Understanding ISO 4406 Particle Counts
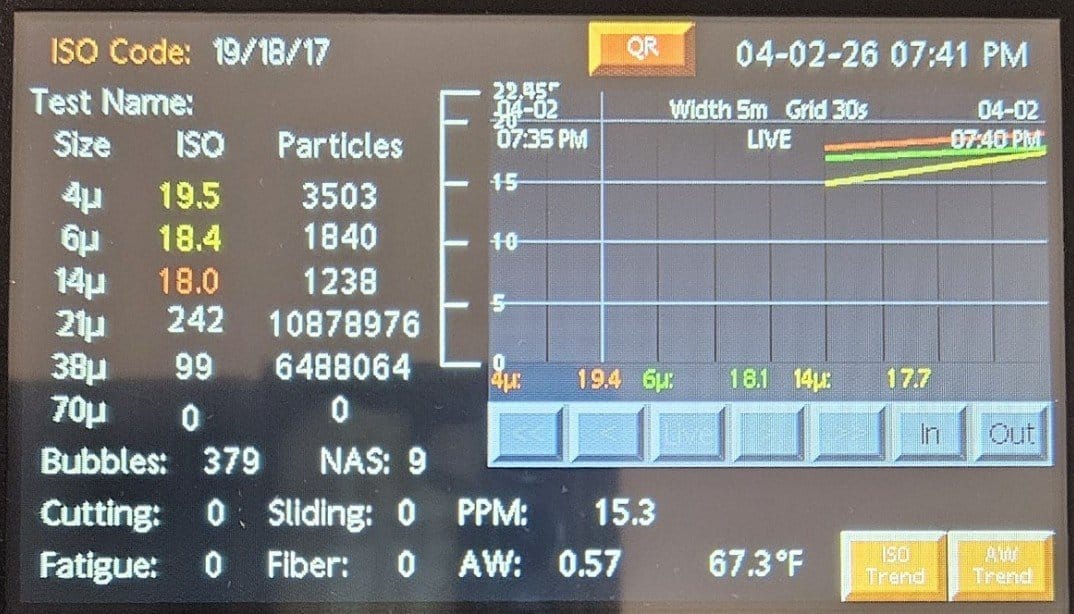
The ISO 4406 standard provides a snapshot of fluid cleanliness using a three-digit code, such as 18/16/13. Each digit represents the number of particles per millilitre of fluid at specific size thresholds: >4µm, >6µm, and >14µm. Current 2026 reporting standards emphasize these codes as the benchmark for system reliability. For example, in an 18/16/13 report, the “18” indicates between 1,300 and 2,500 particles larger than 4 microns. Monitoring these levels in real-time is possible with advanced hardware like the Particle Pal range, which helps operators maintain cleanliness targets between laboratory samples.
Moisture, Acid Number (AN), and Varnish Potential
Water is a destructive contaminant that triggers oil oxidation and additive depletion. Laboratories use Karl Fischer (KF) titration to measure moisture in parts per million (ppm). Even small amounts of dissolved water can reduce bearing life by more than 50%. Alongside moisture, we monitor the Acid Number (AN), which measures the milligrams of potassium hydroxide needed to neutralize the acid in one gram of oil. A rising AN is a clear indicator of oil degradation and increased corrosion risk.
For turbine and EHC systems, Membrane Patch Colorimetry (MPC) is essential. This test measures the potential for the oil to form soft contaminants or varnish. If your MPC values are rising, it’s a signal that the fluid is saturated with degradation by-products. In these cases, implementing a varnish removal system is more effective than a simple oil change, as it removes the sub-micron polar contaminants that standard filters miss. This proactive approach supports both machinery health and environmental sustainability by extending the service life of the lubricant.
The Importance of Trending and Action Limits
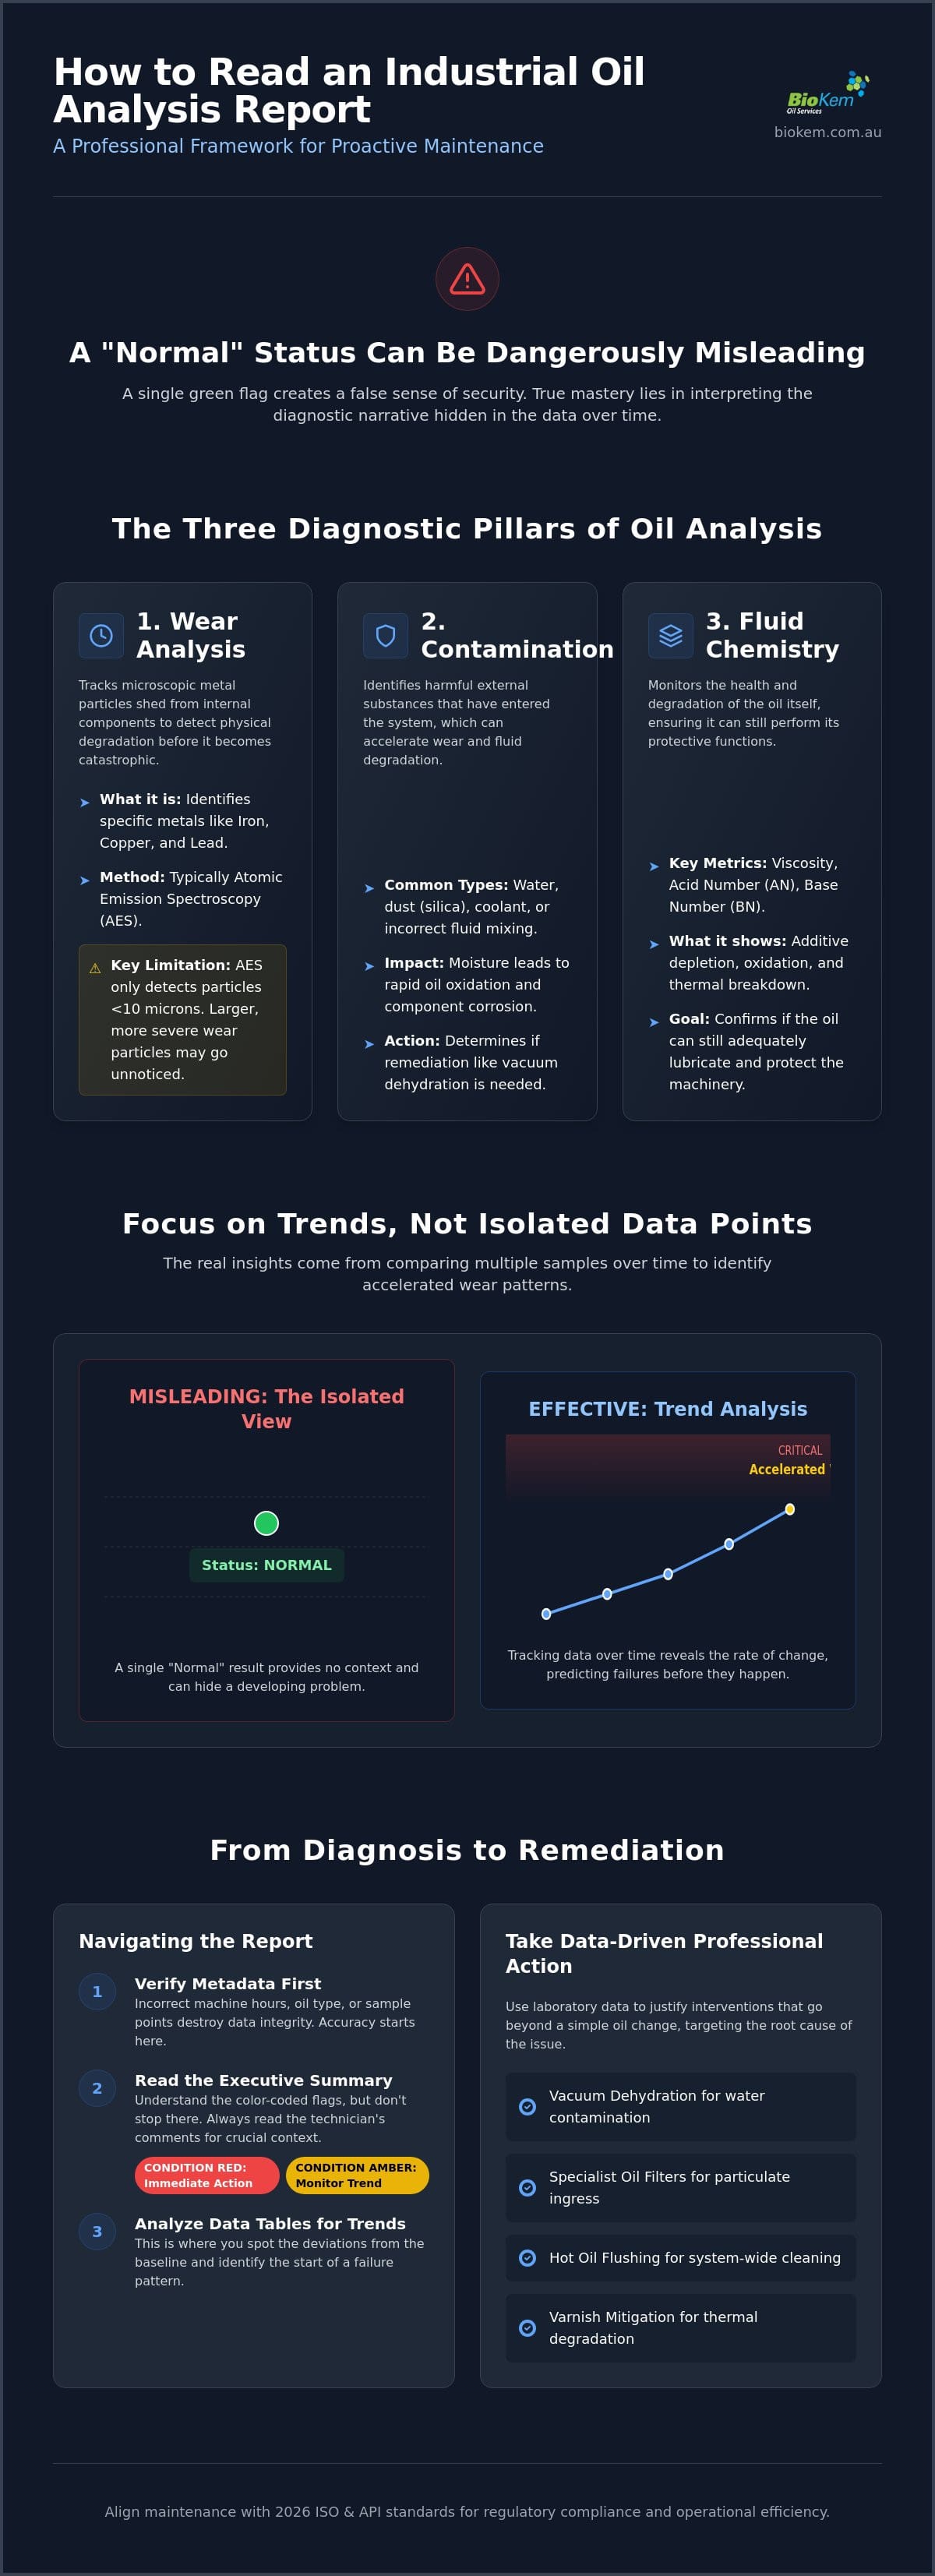
A single data point is merely a snapshot; a trend is a diagnostic narrative. When mastering how to read an oil analysis report, you must prioritize the trajectory of the data over absolute values. A system that has consistently shown 10 ppm of iron for three years is stable. If that same system jumps to 30 ppm in one month, it signals a significant event, even if the laboratory’s generic “critical” threshold is 100 ppm. This rate of change is the most reliable predictor of impending component failure.
Effective interpretation requires a “Baseline” reference. You shouldn’t rely on the lubricant manufacturer’s typical data sheet. Instead, sample the new oil directly from the delivery drum or reservoir after a fresh fill. This establishes the actual starting point for additives and cleanliness. If the report shows a deviation from this baseline, you can adjust your sampling frequency. High-risk assets or those showing “Amber” trends should be sampled more often to capture the acceleration of wear or contamination.
Establishing Proactive Action Limits
Generic laboratory thresholds are often designed to prevent warranty claims rather than maximize asset life. To achieve true reliability, you must define “Cautionary” and “Critical” thresholds specific to your operating environment and machine criticality. An aggressive cleanliness target might be necessary for a high-pressure servo system, whereas a standard gear box can tolerate higher particulate levels. Integrating these custom limits is a core component of Designing a Proactive Maintenance Strategy.
The Danger of “Normal” Reports in Degraded Systems
A “Normal” status can be misleading. As established previously, standard spectrometry misses particles larger than 10 microns. A machine could be shedding large fatigue flakes while the ppm count remains low. Similarly, oil can appear visually clear while possessing a high varnish potential. If your MPC (Membrane Patch Colorimetry) values are trending upward, the fluid is chemically degraded regardless of its particulate count. For advanced wear analysis, Analytical Ferrography provides a microscopic view of particle shape and composition, offering clarity that basic reports lack. If your current reports indicate rising moisture or oxidation, consider equipment hire for onsite purification to restore fluid integrity.
From Diagnosis to Remediation: Taking Professional Action
Understanding how to read an oil analysis report is only the first step in a reliability program. Once you’ve identified a critical trend, the most common error is performing a simple “drain and fill” procedure. This approach is often insufficient because a significant percentage of contaminated fluid remains trapped in dead legs, cylinders, and valve blocks. New oil acts as a solvent; it quickly absorbs these residual contaminants, meaning your fresh lubricant can fall outside of its target ISO cleanliness code within hours of operation. True remediation requires a more technical approach that addresses the root cause identified in the laboratory data.
Professional action involves integrating analysis results into a comprehensive system cleaning strategy. If your report indicates a “Condition Red” for particulates or moisture, you must decide between engaging onsite services or utilizing equipment hire for internal management. Making this choice based on data ensures that your maintenance budget is allocated to high-impact solutions rather than repetitive, ineffective oil changes. BioKem uses these reports to validate the success of every intervention, providing a “post-remediation” sample to prove the system has returned to its required baseline.
Implementing Hot Oil Flushing for Critical Systems
When reports show elevated wear metals or high particulate counts, a Hot Oil Flushing service is the most effective way to restore system integrity. This process uses high-velocity, turbulent flow to scrub the internal surfaces of the piping. Turbulence is essential because it breaks down the “boundary layer” of silt and debris that standard laminar flow cannot move. By targeting specific ISO 4406 codes during the flushing process, we ensure that the system is physically clean before new oil is introduced, preventing the immediate degradation of your lubricant investment.
Varnish Mitigation and Fluid Purification
High MPC (Membrane Patch Colorimetry) reports require specialized intervention. Standard mechanical filters cannot remove the sub-micron, polar degradation products that lead to valve sticking and heat exchanger fouling. Implementing Varnish Removal Systems allows for the continuous extraction of these soft contaminants. For reports showing high moisture in parts per million (ppm), vacuum dehydration is the preferred method for removing dissolved water that triggers oxidation.
Long-term health is maintained by upgrading your filtration hardware. Using Filters S.p.A. products provides the high-efficiency capture rates needed to keep your fluid within 2026 ISO standards. Knowing how to read an oil analysis report empowers you to select the right purification technology, moving your facility from a reactive “fail and fix” cycle to a proactive, data-driven reliability model.
Advancing from Data Interpretation to Asset Reliability
Industrial reliability depends on the transition from passive observation to active fluid management. Mastering how to read an oil analysis report allows you to identify the subtle chemical and mechanical shifts that precede equipment failure. We’ve established that isolated data points are insufficient; true insight comes from tracking the rate of change and implementing targeted remediation like hot oil flushing or varnish mitigation when thresholds are breached.
BioKem provides more than just raw data. As the sole Australian distributor for Filters S.p.A., we combine high-performance filtration technology with specialist onsite services to restore your system to its optimal baseline. Every analysis we perform includes expert technical recommendations to help you navigate complex industrial challenges with confidence. We focus on aligning your operations with the latest 2026 ISO standards to ensure both regulatory compliance and mechanical longevity.
Don’t let data overload compromise your maintenance schedule. Request an Expert Interpretation of Your Oil Analysis Report today to secure the longevity of your critical assets. Proactive interpretation is the most effective way to ensure operational efficiency and environmental responsibility.
Frequently Asked Questions
What is the most important number on an oil analysis report?
The most critical metric is the rate of change between samples rather than any single absolute value. While individual laboratory limits exist, a sudden spike in wear metals or a sharp decline in viscosity signals an active mechanical or chemical event. Understanding these shifts is the core of how to read an oil analysis report effectively. Consistent monitoring allows you to identify deviations from the established baseline before they result in component damage.
How often should I take oil samples for industrial machinery?
Sampling frequency depends on the criticality of the asset and its operating environment. Most industrial machinery requires quarterly sampling to establish a reliable diagnostic trend. High-risk systems, such as EHC fluid units or critical turbines, often require monthly testing. If a report indicates a cautionary status, you should increase the frequency to monitor the acceleration of the identified issue until professional remediation occurs.
Why does my report show high iron but the oil looks clean?
High iron concentrations often consist of particles smaller than 10 microns, which are invisible to the naked eye. Standard laboratory spectrometry detects these microscopic elements even when the fluid appears visually clear. This discrepancy highlights why visual inspections are insufficient for modern reliability programs. If spectrometric iron is rising, it indicates internal abrasive wear or fatigue that requires investigation through more advanced methods like analytical ferrography.
What is the difference between Acid Number (AN) and Base Number (BN)?
Acid Number (AN) measures the concentration of acidic by-products caused by oil oxidation and degradation. It’s the primary indicator of fluid health in industrial and hydraulic systems. Base Number (BN) measures the alkaline reserve used to neutralize acids, primarily in internal combustion engines. A rising AN indicates that the lubricant is losing its chemical stability and may soon begin to form sludge or corrosive varnish.
Can oil analysis predict a bearing failure before it happens?
Oil analysis accurately predicts bearing failure by identifying abnormal concentrations of copper, lead, and tin. By monitoring these wear metals alongside particle morphology, technicians detect the transition from normal rubbing wear to severe fatigue. This early detection provides a window for scheduled maintenance, preventing the catastrophic damage and unscheduled downtime associated with sudden mechanical collapse. It’s an essential part of how to read an oil analysis report for predictive maintenance.
How do I know if my ISO 4406 particle count is too high?
Your ISO 4406 particle count is too high if it exceeds the target cleanliness code specified for your most sensitive component. For example, high-pressure servo valves typically require a 16/14/11 rating, while standard gearboxes might tolerate 19/17/14. If your report shows values higher than these targets, it indicates that current filtration is inadequate and requires intervention such as hot oil flushing or the installation of specialist oil filters.
What should I do if my report comes back with a “Critical” flag?
A “Critical” flag requires immediate verification of the sample integrity to rule out collection errors. Once you’ve confirmed the data is accurate, you must perform a root cause analysis to identify the source of the deviation. Professional remediation, such as vacuum dehydration or varnish mitigation, should be scheduled immediately to stabilize the system. This prevents further degradation of the internal components and avoids a total system failure.
Does a high water content always mean I need to change the oil?
High water content doesn’t always necessitate a complete oil change. Dissolved and emulsified water can be effectively removed through vacuum dehydration, which restores the lubricant’s lubricity properties. This approach is more sustainable and cost-effective than a full fluid replacement. However, if the water has already triggered significant oxidation or additive depletion, the oil may require replacement to ensure the system remains protected from corrosion and wear.

Article by
James McAllister
James McAllister is an industry professional with BioKem Oil Services, specialising in lubrication reliability, oil filtration, contamination control and asset performance. Drawing on BioKem's extensive field experience across turbines, compressors, hydraulic systems and critical rotating equipment, James writes practical, insight-driven articles that help maintenance and reliability teams improve equipment performance, extend asset life and reduce operational risk.