What if your most expensive equipment failure has already started, but the evidence is currently buried under a pile of data you don’t have time to read? You likely understand the pressure of maintaining peak operational efficiency while your desk accumulates technical data that feels impossible to action. It’s overwhelming to receive an oil analysis report filled with complex ISO 4406 codes and chemical markers when you’re simply trying to prevent a A$60,000 gearbox replacement. Data shouldn’t be a burden. We agree that laboratory results should provide clarity, not confusion, especially when Australian regulatory standards demand both high performance and environmental responsibility.
This guide promises to give you the tools to decode those dense reports, identify “silent killers” like varnish, and extend the life of your industrial lubricants through scientific precision. You’ll gain a clear roadmap for justifying your maintenance spend and choosing nature-based purification over costly, wasteful oil changes. We’ll cover how to translate raw data into a proactive remediation strategy that protects your machinery and your bottom line.
Key Takeaways
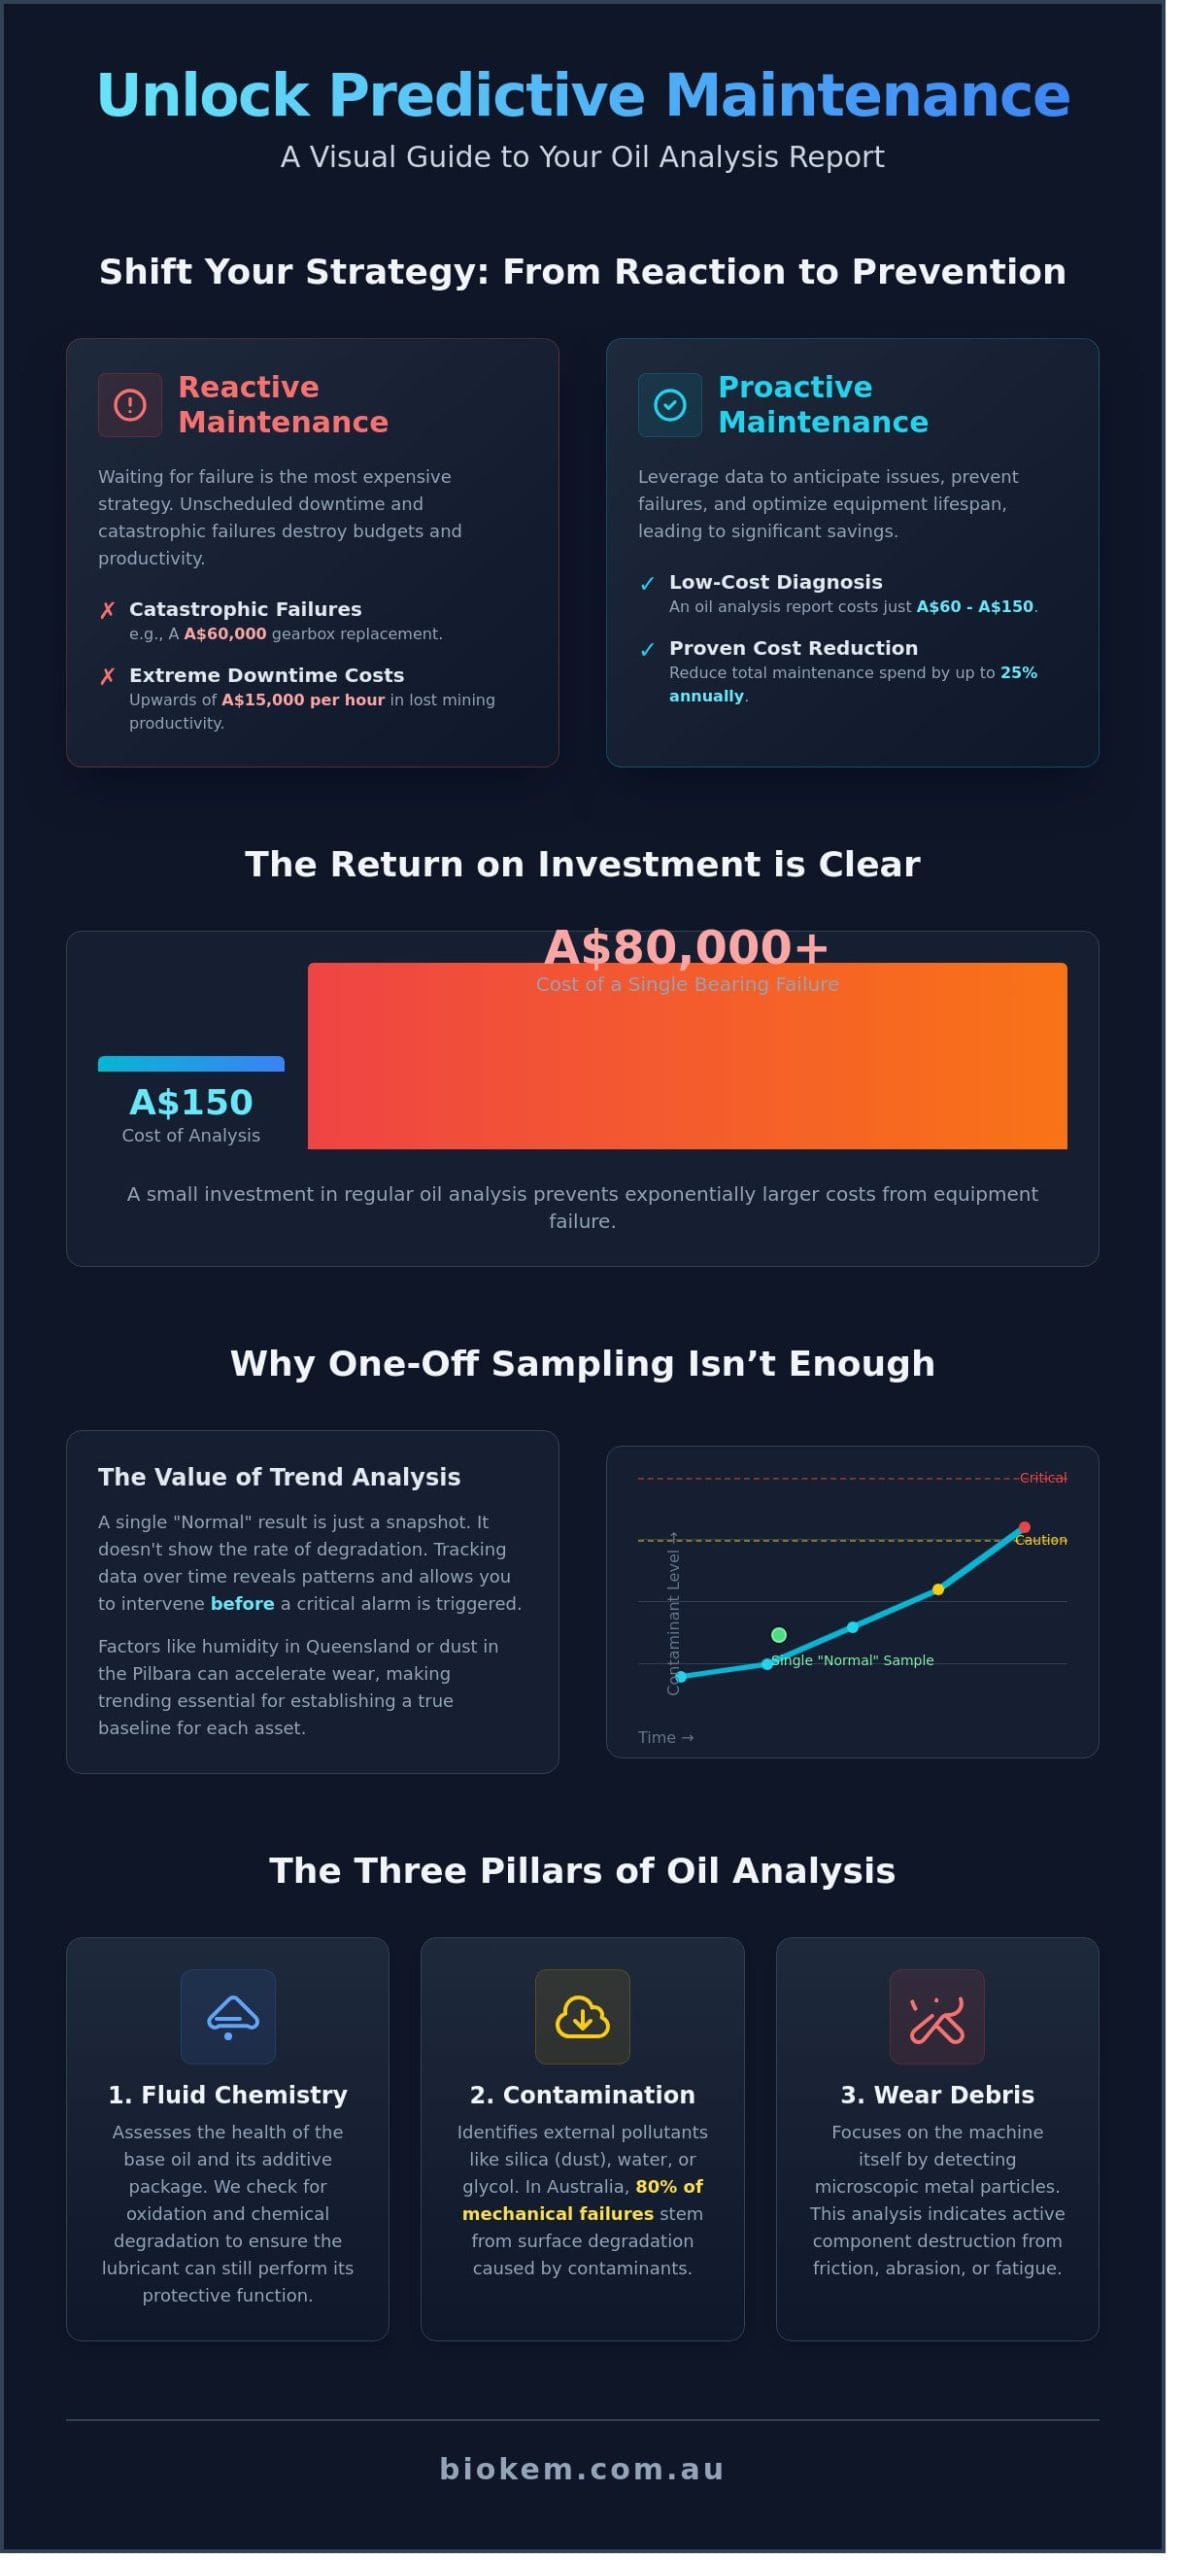
- Shift from reactive maintenance to a proactive strategy by leveraging diagnostic data to prevent unscheduled downtime and catastrophic equipment failure.
- Decode the technical metrics within your oil analysis report, focusing on critical indicators like viscosity to ensure optimal lubricant performance.
- Recognise why longitudinal trending is more valuable than a single “Normal” result when interpreting lab status indicators for long-term operational reliability.
- Implement a structured response to critical alerts by verifying sample integrity and auditing filtration systems to identify hidden failure points.
- Explore how onsite technical interventions and integrated management support the unique operational demands and regulatory standards of the Australian industrial sector.
Understanding the Role of the Oil Analysis Report in Predictive Maintenance
An oil analysis report serves as the primary diagnostic tool for assessing industrial lubrication health. It provides a detailed look at the internal condition of your machinery without requiring invasive teardowns. To understand the foundational science, What is Oil Analysis? offers a useful starting point for operators looking to improve their maintenance strategies. Transitioning from reactive to proactive maintenance depends on this data. Instead of waiting for a component to fail, maintenance teams use these reports to identify early warning signs of degradation. This shift prevents unscheduled downtime, which can cost an Australian mining operation upwards of A$15,000 per hour in lost productivity.
The return on investment for regular monitoring is clear. A standard oil analysis report typically costs between A$60 and A$150. Compare this to the cost of a catastrophic bearing failure in a heavy excavator, which often exceeds A$80,000 including parts, labor, and logistics. By identifying high silicon levels or abnormal wear patterns early, companies can reduce total maintenance spend by 25% annually.
To better understand this concept, watch this helpful video:
In the harsh industrial landscapes of Western Australia and Queensland, environmental factors dictate tighter sampling intervals. The Pilbara’s fine iron ore dust and the high humidity of the Bowen Basin create unique challenges for hydrocarbon management. Standard OEM intervals often prove insufficient in these regions. High-velocity dust particles as small as 5 microns can bypass standard filtration, leading to accelerated abrasive wear. Regular testing ensures that these environmental invaders don’t compromise the biological and chemical integrity of the lubricant.
Why One-Off Sampling Isn’t Enough
A single data point only provides a snapshot in time. Effective predictive maintenance relies on trend analysis to establish a baseline for each specific asset. Environmental factors like the 90% humidity levels found in tropical Queensland can lead to rapid moisture ingression. This moisture promotes oxidation and can even support microbial growth in certain biodegradable oil types. By comparing current results against historical data, technicians can spot deviations before they reach critical alarm limits. These limits are typically set based on a combination of OEM guidelines and the specific operational history of the machine.
The Three Pillars of Oil Analysis
To maintain operational efficiency and environmental compliance, we evaluate three distinct categories within every report:
- Fluid Chemistry: We examine the additive package and base oil health. We need to know if the lubricant is still capable of protecting the machine or if oxidation has rendered it ineffective.
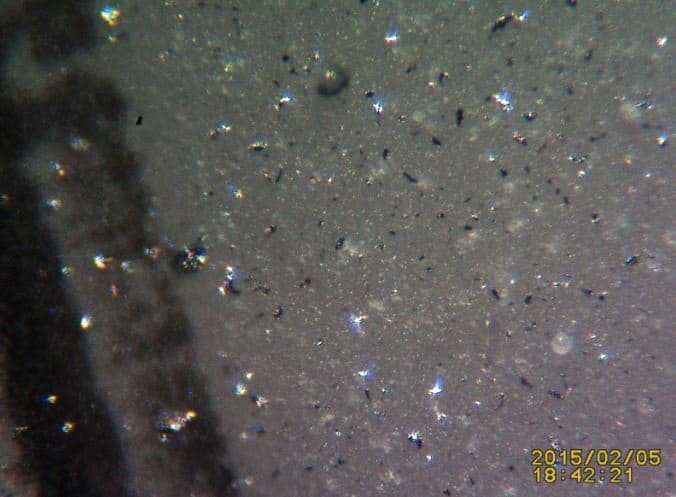
- Contamination: This identifies external pollutants like silica dust, water, or glycol. In Australian mining and construction, 80% of mechanical failures stem from surface degradation caused by these contaminants.
- Wear Debris: This pillar focuses on the machine itself. We look for microscopic metal particles that indicate the machine is actively destroying its own components through friction or fatigue.
Decoding the Metrics: What the Numbers Actually Mean
An oil analysis report shouldn’t be viewed as a mere collection of confusing digits. It’s a sophisticated diagnostic tool that provides a window into the internal health of your machinery. To get the most value, maintenance teams must translate technical jargon into actionable maintenance tasks. Viscosity remains the single most important physical property of any lubricant. It dictates the fluid’s ability to maintain a protective film between moving parts. If your report shows a viscosity shift of more than 10% from the baseline, it’s a clear signal that the oil is either oxidising or being diluted by fuel or water.
Elemental analysis further refines this picture by categorising particles into three groups: wear metals, additives, and contaminants. Wear metals like iron or copper indicate component fatigue, while levels of zinc or phosphorus show the remaining strength of your additive package. Understanding the fundamentals of oil analysis reports helps you distinguish between normal “break-in” wear and catastrophic failure patterns. For immediate verification between lab cycles, many Australian sites utilise patch test kits to get a rapid visual confirmation of large particulate presence.
ISO 4406 Cleanliness Codes Explained
The ISO 4406 standard uses a three-digit code to represent the number of particles larger than 4μm, 6μm, and 14μm per millilitre of fluid. A code like 18/16/13 might seem acceptable to the untrained eye, but the scale is logarithmic. This means every single-digit drop in the ISO code effectively halves the contaminant load, which can double the service life of sensitive components like servo valves. When codes exceed the manufacturer’s limit, it’s time to consider hot oil flushing and filtering to restore the system to a baseline of “as-new” cleanliness.
Moisture and Water Contamination
Water is the second most destructive contaminant after particulate matter. It exists in three states: dissolved, emulsified, and free water. Emulsified water is often the most dangerous because it’s thoroughly mixed with the oil, making it difficult to remove and highly reactive. We measure these levels using the Karl Fischer Titration method, which provides results in parts per million (PPM). In critical Australian mining or industrial gearboxes, water levels exceeding 200 PPM can trigger rapid oil oxidation and additive depletion. This chemical reaction creates acids that etch metal surfaces and destroy the lubricant’s molecular structure.
Varnish Potential and MPC Testing
Standard elemental analysis often fails to detect the sub-micron degradation products that lead to varnish. Membrane Patch Colorimetry (MPC) is the gold standard for predicting this risk. It involves filtering a sample through a fine patch and measuring the colour change with a spectrophotometer. An MPC value above 30 indicates that the oil is saturated with soft contaminants that will soon plate out as “sticky” varnish on cooler surfaces. If your oil analysis report reveals high varnish potential, integrating a varnish removal system is a proactive way to prevent valve sticking and heat exchanger fouling. Maintaining these metrics is a core part of a responsible, eco-friendly maintenance strategy that extends the life of both the fluid and the machine. You can consult with our technical team to establish site-specific alarm limits for your most critical assets.
Interpreting the “Traffic Light” System and Trending
Most laboratories provide an oil analysis report using a simple Green, Yellow, and Red status indicator. Green signals the fluid is within specification; Yellow suggests a “Caution” state where monitoring should increase; Red demands immediate intervention. Relying solely on these colours is a common mistake for maintenance teams. A “Green” result can be misleading if the data shows a 45% increase in wear metals compared to the previous month. This upward trajectory often signals a developing fault long before the absolute limit is reached. Consistent trending identifies these deviations early, allowing for scheduled repairs rather than emergency downtime.
Sudden death indicators require an immediate machine shutdown to prevent catastrophic failure. If your oil analysis report shows a sudden 300% spike in Iron or a total loss of viscosity, the risk of seizure is high. Standard laboratory tests often miss these warnings because they only detect particles smaller than 10 microns. Integrating a filter ferrogram allows technicians to examine larger wear particles, providing a visual “DNA profile” of the machine’s internal health that spectroscopy ignores. This analysis identifies the shape, size, and composition of debris to pinpoint exactly which component is failing.
Analyzing Wear Metal Trends
Monitoring the relationship between different metals provides a roadmap to the failing component. Iron (Fe) typically originates from gear teeth, bearings, or cylinder liners. Copper (Cu) usually points to wear in bushings, thrust washers, or oil coolers. In high-pressure hydraulic systems or heavy-duty engines, Chromium and Aluminium levels act as critical indicators of ring or piston degradation. Normal Wear is the expected rate of metal loss over a specific hourly interval. When these rates accelerate, it’s a sign that the lubrication film is failing or contamination is present.
Additive Depletion and Fluid Health
Anti-wear packages rely on specific concentrations of Zinc, Phosphorus, and Calcium to protect metal surfaces under load. When these levels drop 25% below the virgin oil baseline, the fluid’s protective capacity is compromised. The Total Acid Number (TAN) tracks the chemical breakdown of the oil; a TAN increase of 2.0 mg KOH/g over the starting point indicates the fluid is becoming corrosive and oxidized. This chemical shift leads to varnish formation and component pitting.
Rather than performing a costly full oil change, 65% of Australian industrial sites now consider oil purification as a sustainable alternative. This process removes moisture and microscopic particulate, extending the life of the existing lubricant. It’s a practical approach that aligns with Australian environmental standards while reducing the volume of waste oil generated on-site. Choosing purification over replacement can save a facility upwards of A$15,000 annually per large reservoir by maintaining the fluid’s chemical integrity without the need for fresh stock.
From Data to Action: How to Respond to a Critical Report
Receiving an oil analysis report with a red “critical” status requires a measured, technical response rather than a panic-driven oil dump. A single batch of high-performance hydraulic fluid for a large industrial press often costs upwards of A$15,000. Discarding it prematurely is both economically wasteful and environmentally irresponsible. The goal is to move through a logical sequence of verification and remediation to restore system health without unnecessary expenditure.
The first step is to verify sample integrity. You must confirm the sample was taken correctly from a live zone while the machine was at operating temperature. Statistics from industrial maintenance audits show that 12% of critical reports result from poor sampling technique or contaminated sample bottles. If the sample was taken from the bottom of a cold sump, the results will be skewed. Once the data is confirmed, inspect the filtration system and breathers. If a desiccant breather has fully changed colour or a filter bypass indicator is tripped, you’ve identified the entry point for contaminants. You can then determine if the oil can be saved through purification or if a full system flush is required to remove the root cause of the alarm. Understanding how to take an oil sample using professional techniques ensures your future reports provide accurate data for maintenance decisions.
When to Choose Hot Oil Flushing
Hot oil flushing is essential when an oil analysis report reveals heavy varnish, sludge, or scale within the system. Think of this as cleaning the “arteries” of your machinery. Simply draining the sump is often a waste of money because up to 20% of the old, contaminated fluid remains trapped in the pipework. Using paddle flushing screens allows technicians to verify cleanliness in real-time by capturing debris until the system meets specified ISO 4406 targets. This high-velocity turbulent flow removes deposits that static oil changes leave behind, ensuring your new A$20,000 oil charge isn’t immediately ruined by residual grit.
Purification Strategies: Vacuum Dehydration and Filtration
Water is the second most destructive contaminant after particulate matter, often leading to rapid oxidation and component pitting. Vacuum dehydration removes free, emulsified, and dissolved water down to 50 ppm without altering the oil’s chemical structure or stripping out additives. As the Australian distributor for Filters S.p.A., BioKem Oil Services provides high-performance elements that capture sub-micron particles. Implementing kidney-loop filtration allows you to maintain strict ISO targets while the machine stays online. This approach prevents the 30% increase in wear rates typically observed when moisture levels exceed 200 ppm in sensitive hydraulic systems.
Technical remediation is more cost-effective than constant oil replacement. It’s a sustainable strategy that aligns with Australian regulatory expectations for waste reduction. By targeting the root cause, you extend component life by 50% or more in most heavy industrial applications.
Contact BioKem Oil Services today to discuss a technical remediation plan for your critical machinery.
BioKem: Your Partner in Integrated Lubrication Management
BioKem transforms the way industrial operations handle fluid health by bridging the gap between raw data and mechanical reliability. We don’t just provide a laboratory result; we offer a roadmap for asset longevity. Our unique approach combines high precision laboratory diagnostics with heavy duty technical services performed directly on your site. This integration ensures that the insights gained from your oil analysis report translate into tangible mechanical improvements that protect your bottom line.
In the Australian mining and power sectors, environmental conditions are often extreme. High ambient temperatures and heavy particulate loads accelerate lubricant degradation. BioKem provides onsite technical interventions that address these challenges at the source. We deploy mobile filtration units and specialized technicians to remote sites from the Pilbara to the Hunter Valley. These interventions prevent catastrophic component failure and ensure that machinery remains compliant with AS 1940 standards for storage and handling of flammable and combustible liquids.
Integrating heat transfer systems services into your maintenance plan is a strategic move for thermal efficiency. When thermal fluids degrade, they form carbon deposits that can reduce heat transfer efficiency by 18% or more. Our team monitors these systems to prevent fluid “cracking” and oxidation. By maintaining fluid chemistry, we help you avoid the A$60,000 plus costs associated with premature system flushes and heater coil replacements.
Sustainability is a core pillar of our service delivery. BioKem focuses on oil life extension, which reduces the volume of waste oil generated by your facility. Extending the service life of a hydraulic system by 40% significantly lowers your environmental footprint and reduces waste disposal costs. For a mid sized mining operation, this can result in a reduction of 15,000 litres of waste oil annually. This nature based approach to reliability aligns your operational goals with modern ESG requirements.
Specialized Equipment and Distribution
BioKem serves as the primary distributor for oil filtration systems across Australia. We provide local access to world class hardware, including Swift Filters, which are essential for maintaining ISO 4406 cleanliness codes in critical applications. Our hardware solutions are backed by local technical expertise, ensuring that you receive the correct filtration media for your specific fluid type and flow rate. This local support eliminates the long lead times often associated with international equipment procurement.
Closing the Loop on Reliability
We act as the “boots on the ground” for reliability engineers who need to move beyond static PDF reports. An oil analysis report indicates a problem, but BioKem solves it. Consider a 2023 case study where a Queensland power plant identified critical varnish levels in a turbine. BioKem implemented a targeted varnish mitigation project using electro physical separation. We removed 99% of soft contaminants and restored the oil to a “like new” state. This intervention saved the client A$55,000 in lubricant replacement costs and prevented an unplanned outage. Taking the next step toward fluid excellence is simple. Contact BioKem for a comprehensive oil health audit to begin your journey toward integrated reliability.
Transforming Industrial Data into Operational Reliability
Mastering these industrial diagnostics transforms raw data into a strategic asset for your facility. You’ve learned how to decode elemental ppm counts and interpret the critical “traffic light” alerts that signal impending component failure. Implementing these insights reduces unplanned downtime and extends the service life of industrial lubricants by identifying contamination before it causes wear.
BioKem provides the technical expertise needed to navigate these complex diagnostics while maintaining a commitment to ecological health. As the sole Australian distributor for Filters S.p.A., we combine world-class filtration technology with local precision. Our NATA accredited laboratory partners ensure every sample meets rigorous Australian standards for accuracy. We’re specialists in hot oil flushing and varnish mitigation, providing the practical solutions required to restore your systems to peak efficiency without heavy chemical reliance. Don’t let critical data sit unread on a desk. Take control of your maintenance schedule and protect your bottom line with expert guidance from a trusted partner.
Get a Professional Interpretation of Your Oil Analysis Report Today
Your journey toward sustainable, high-performance lubrication starts with a single, well-interpreted sample.
Frequently Asked Questions
How often should I perform oil analysis on my industrial equipment?
You should perform oil analysis every 500 to 1,000 operating hours or on a quarterly basis for critical assets. Following AS 60034 standards ensures maintenance cycles align with manufacturer specifications. Establishing a baseline within the first 100 hours of operation allows for accurate trend monitoring. Regular testing reduces the risk of unplanned downtime, which costs Australian mining operations up to A$150,000 per hour in lost productivity.
What is the most critical metric in an oil analysis report?
Viscosity is the most critical metric in an oil analysis report because it determines the lubricant’s ability to maintain a protective film. A 10% deviation from the base oil’s viscosity grade signals severe oxidation or thermal degradation. If the viscosity drops below the minimum threshold, metal-to-metal contact occurs. This leads to accelerated component wear and eventual system failure in high-load industrial environments.
Can oil analysis detect a bearing failure before it happens?
Oil analysis detects 90% of bearing failures by identifying microscopic wear particles before vibration sensors trigger an alarm. Spectrometric analysis measures elements like copper, lead, and tin in parts per million (ppm). An increase of 15 ppm in lead levels over a single month often indicates babbitt layer erosion. Early detection through these chemical signatures allows for scheduled maintenance instead of catastrophic onsite breakdowns.
What does a high ISO 4406 code mean for my hydraulic system?
A high ISO 4406 code indicates that your hydraulic system contains a high concentration of solid contaminants. For example, a code of 22/20/18 means there are between 20,000 and 40,000 particles larger than 4 microns per millilitre of fluid. This level of contamination causes abrasive wear on valves and pumps. Reducing this code to 16/14/11 can extend the component life of hydraulic machinery by 300%.
Is it better to use a laboratory or onsite oil analysis?
Laboratory testing is superior for comprehensive diagnostics, while onsite analysis provides immediate results for basic parameters like moisture and viscosity. Certified Australian laboratories use ASTM D5185 standards to provide a complete oil analysis report with sub-micron accuracy. Onsite kits are useful for daily checks, but they lack the sensitivity to detect complex chemical changes or varnish precursors that professional lab equipment identifies.
How do I take a proper oil sample to ensure report accuracy?
You should take an oil sample from a live zone while the machine is at normal operating temperature to ensure a representative data set. Flush the sampling valve with at least 500 millilitres of fluid to remove stagnant debris before filling the bottle. Don’t take samples from the bottom of a reservoir where sediment settles. Proper technique ensures the data reflects the actual condition of the circulating lubricant. Following the professional guide to representative sampling eliminates false positives that can trigger unnecessary maintenance actions.
What should I do if my oil report shows “Critical” for varnish?
You must implement sub-micron filtration or varnish removal services if your report shows a Membrane Patch Colorimetry (MPC) value above 30. Varnish deposits cause valves to stick and increase operating temperatures by 15 degrees Celsius due to reduced heat transfer. BioKem provides specialised remediation that restores the oil’s solubility. Addressing varnish early prevents the need for a full oil change, saving up to A$20,000 in fluid replacement costs.
Does BioKem provide the sampling kits as well as the remediation services?
BioKem provides both professional sampling kits and comprehensive remediation services tailored to Australian industrial standards. Our kits include all necessary components for clean extraction, while our technical team handles the subsequent filtration and chemical restoration. We focus on nature-based solutions to extend the life of your lubricants. This integrated approach ensures your maintenance program meets environmental compliance targets while reducing total waste.