
Maximize Equipment Life: Understanding Your Lube Lab Reports
Your lubricant lab reports serve as an early warning system, helping you identify issues before they escalate into costly repairs or downtime. By regularly analyzing and testing your lube oil, you can extend the life of your equipment and ensure optimal performance. Here’s how to interpret key indicators from your lab report to take proactive action.
5 Key Indicators to Check on Your Lube Oil Lab Reports
Lab reports provide critical insights into the current condition of your lubricant and how it’s evolving over time. They aren’t just about oil degradation; they offer a snapshot of your oil’s quality and provide actionable recommendations to prevent the lubricant from falling below acceptable standards.
Here are the top five things to look for when reviewing your lab report:
1. Is it the Right Report?
The first thing to check sounds obvious, but it is very important. You should check that the report is your report, and that it is for the specific machine you are assessing. This is particularly important if you are responsible for the operation of multiple machines, or multiple sites.
The information that is typically included on a Lab Report includes:
- Unit ID
- Unit make
- Unit model
- Unit serial number
- Site or location of the unit
- Compartment name, ID, make, model, serial number
- Capacity
- Lubricant manufacturer
- Lubricant type
- Lubricant grade
The report will also give details of when the sample was taken, as well as when it was received in the lab and reported on. All of this information will help you confirm that the report is the one that you should be assessing.
Tip – If the sample details seem incorrect, labeling issues may have occurred during the testing process.
2. Review Physical Properties of the Lubricant
The next step is to examine the data from the physical tests of the most recent sample. Water levels, or moisture content, are likely to be a significant concern. These levels are usually reported in parts per million (PPM) or as a percentage of saturation. In the report, you should look for how close the moisture levels are to the saturation point. Since oils vary widely, there is no universal benchmark threshold; therefore, consult your OEM recommendations for acceptable oil and machine moisture levels.
Other physical properties to check include:
- ISO 4406 Rating: Indicates particle contamination levels.
- TAN (Total Acid Number): Tracks additive depletion.
- TBN (Total Base Number): Monitors combustion environment impacts.
- Viscosity: Consistency is crucial.
- PQ Index: Measures ferrous metal content.
- Color: A significant color change may indicate oil contamination or blending.
- Oxidation: Tracks oil degradation over time.
ISO 4406 ratings provide a standard measurement of particle contamination in lubricants, expressed as three numbers (e.g., 18/15/10). Each number represents the quantity of particles in three different size ranges, with the first number indicating the smallest particles and the last number the largest.
For instance, in the rating 18/15/10:
- There are between 1,300 and 2,500 particles that are ≥ 4µm.
- There are between 160 and 320 particles that are ≥ 6µm.
- There are between five and ten particles that are ≥ 14µm.

Here is the chart with the ISO 4406 range codes which you can use to reference your result. The first number is a range code (the number you will see on your report), and the second is a range in parts per millilitre:
- 24 – Between 80,000 and 160,000 particles
- 23 – Between 40,000 and 80,000 particles
- 22 – Between 20,000 and 40,000 particles
- 21 – Between 10,000 and 20,000 particles
- 20 – Between 5,000 and 10,000 particles
- 19 – Between 2,500 and 5,000 particles
- 18 – Between 1,300 and 2,500 particles
- 17 – Between 640 and 1,300 particles
- 16 – Between 320 and 640 particles
- 15 – Between 160 and 320 particles
- 14 – Between 80 and 160 particles
- 13 – Between 40 and 80 particles
- 12 – Between 20 and 40 particles
- 11 – Between 10 and 20 particles
- 10 – Between 5 and 10 particles
- 9 – Between 2.5 and 5 particles
- 8 – Between 1.3 and 2.5 particles
- 7 – Between 0.64 and 1.3 particles
- 6 – Between 0.32 and 0.64 particles
Warning – As soon as you see high moisture levels, take action. This will destroy the additives and drag your lube oil out of spec with disastrous results.
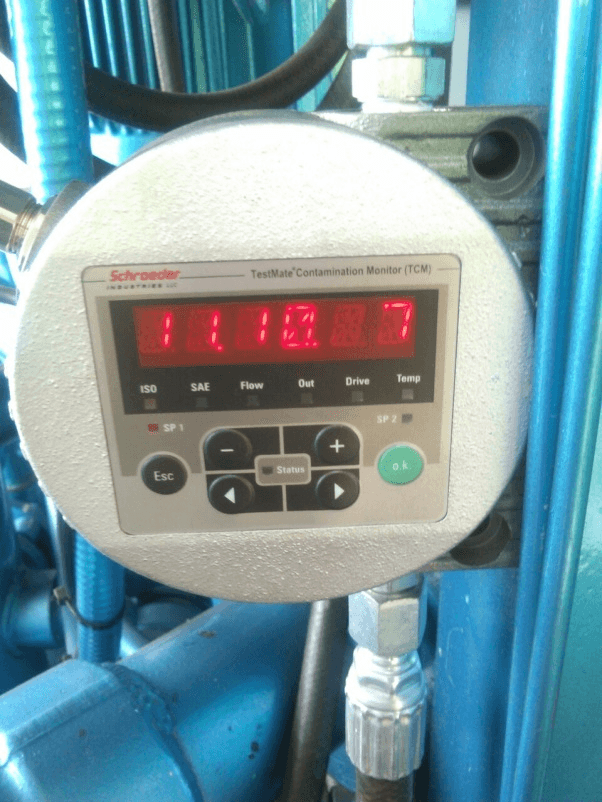
Digital Particle counter on a VDOPS reading 11/10/7. Very clean oil.
3. Metals and Contaminants Analysis
Elemental spectroscopy identifies the presence of wear metals and contaminants, typically measured in PPM (parts per million). The report will list elements like iron, chromium, aluminum, and lead, which can indicate wear debris from your machine’s components. High levels of these metals may suggest mechanical issues that need addressing.
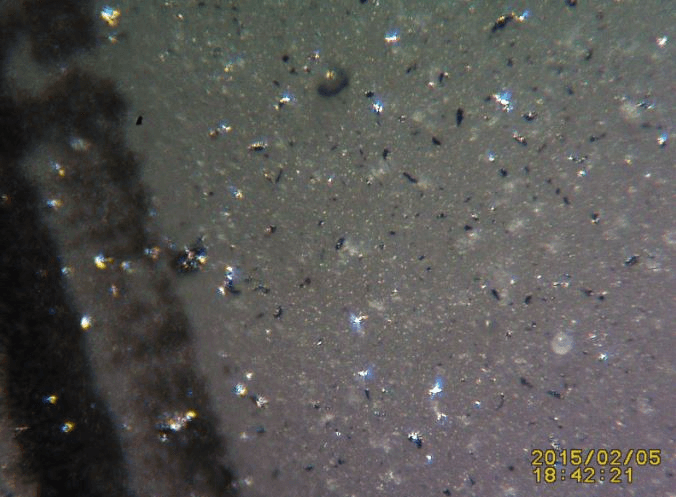
BioKem Oil Services Patch Test at 100x Mag showing severe chromium wear debris
4. Compare Trends Over Time
Analysing trends from past samples is one of the most valuable aspects of your lab report. Look for gradual increases in contaminants or changes in lubricant quality. This trend analysis helps you predict when restoration or maintenance work might be necessary, ensuring your equipment operates smoothly and reducing downtime.
5. Read the Summary and Recommendations
Lab technicians often provide a summary of the report, confirming your own interpretation of the data. Pay close attention to any recommended actions, such as scheduling the next test or maintenance tasks. Taking these recommendations seriously can help catch potential problems early.
Conclusion: Ensure Maximum Equipment Efficiency
Regular review of your lubricant lab reports is critical to maintaining your equipment’s performance. Checking for the right indicators and acting on trends can help extend the life of your machinery and prevent costly breakdowns. Remember to verify that particle counts, moisture levels, and contaminant levels remain within acceptable limits.
Cost-Benefit Analysis: Preventative maintenance through regular oil testing and analysis is far more cost-effective than addressing failures caused by poor lubrication.
If you would like further information on this article or others, please feel free to contact us.